2018 biopharma startup report
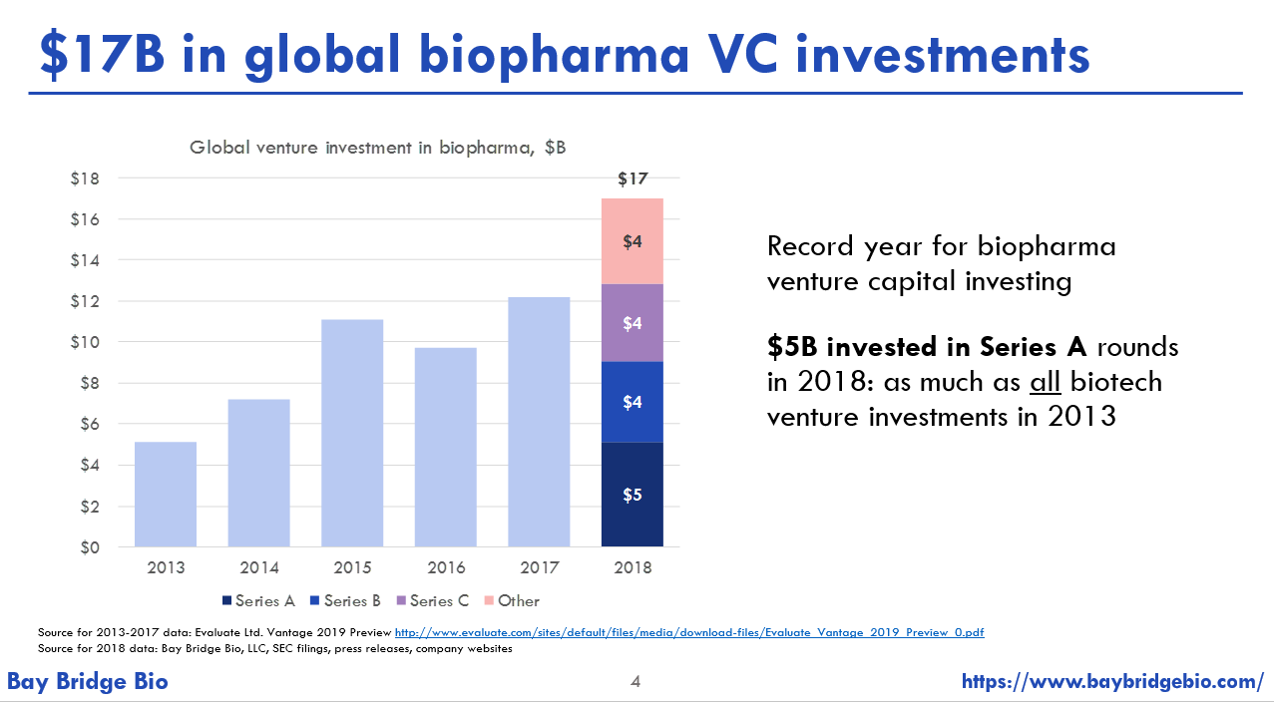
Details on $17B of VC investments and hundreds of investors.
In-depth coverage of $34B of venture-backed IPOs and $37B in venture-backed M&A.
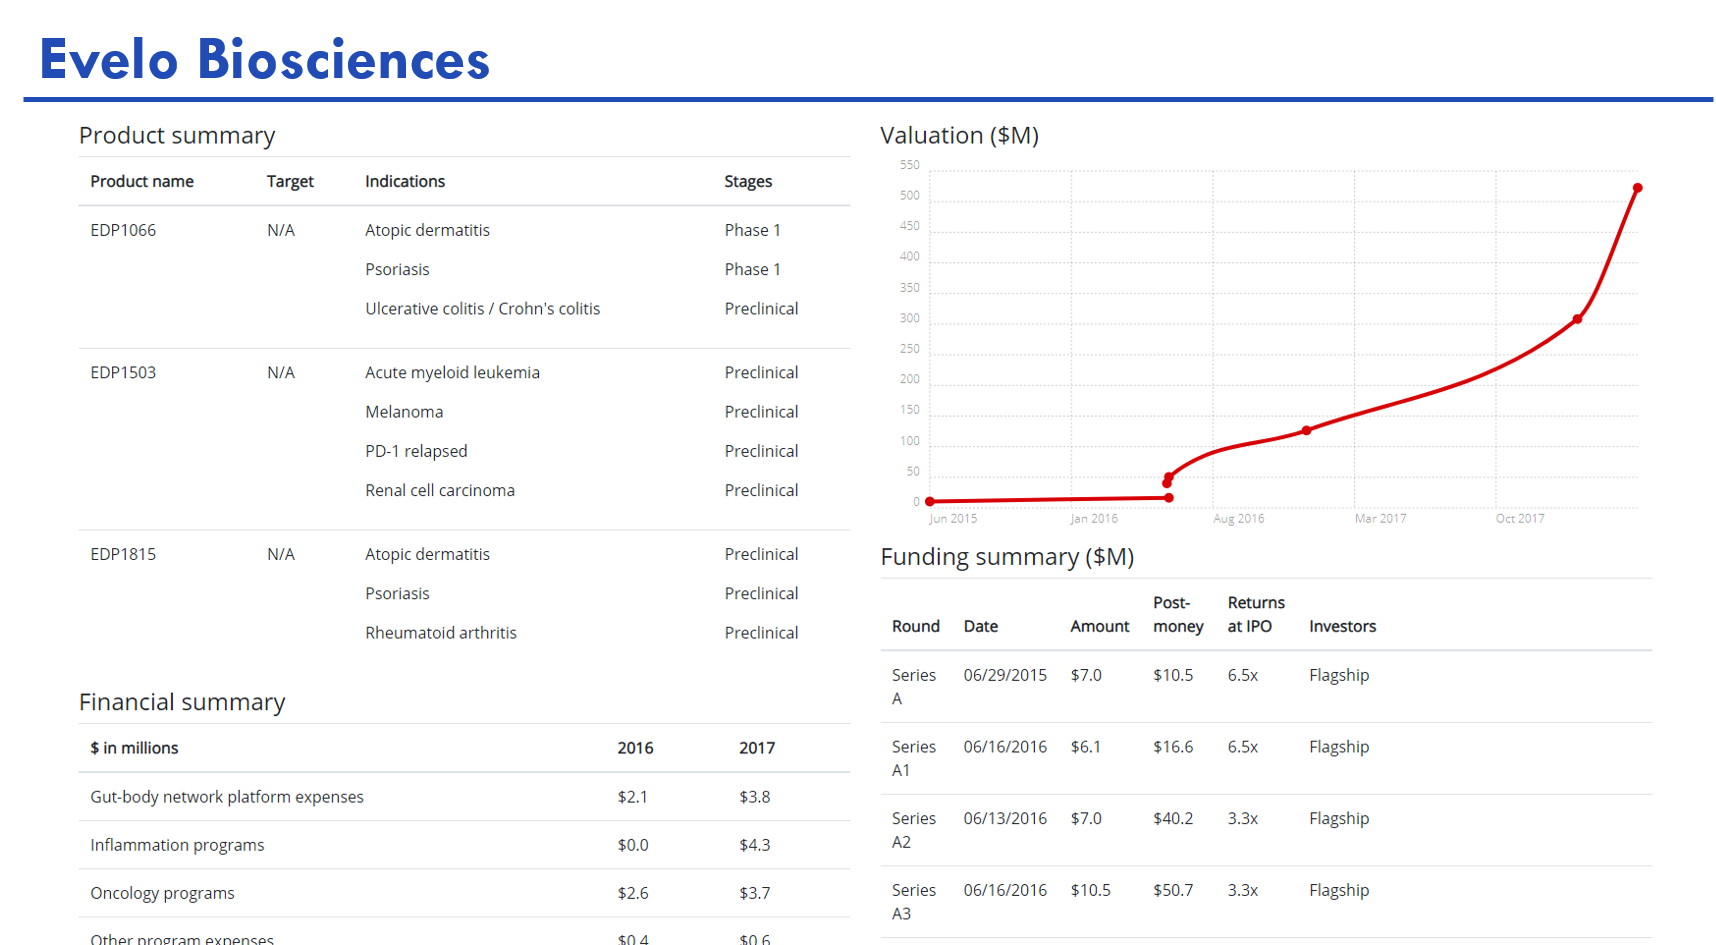
Thousands of data points on 2018 IPOs: private round valuations, spend by R&D program, and more.
Monitor the pulse of the industry
Will 2019 be a year of bounty or volatility? Look beyond the NASDAQ Biotech Index with our coverage of 2018 activity, including $17B in venture investment, venture-backed IPOs worth $34B, and $37B in venture-backed M&A.
See what's getting funded
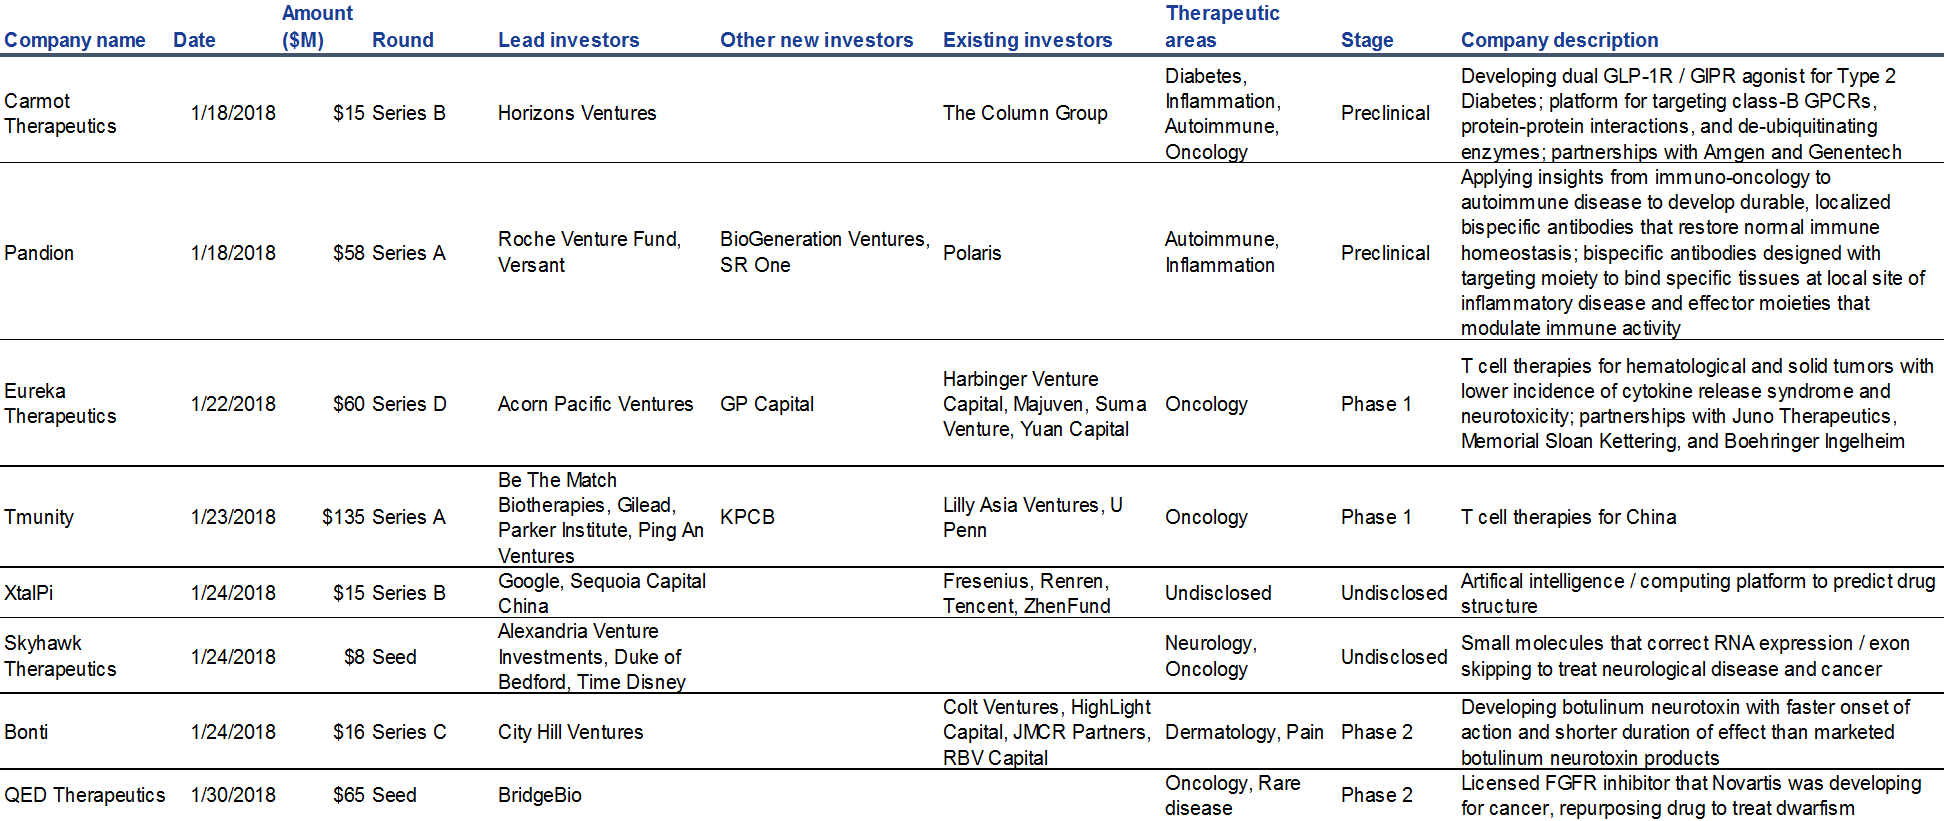
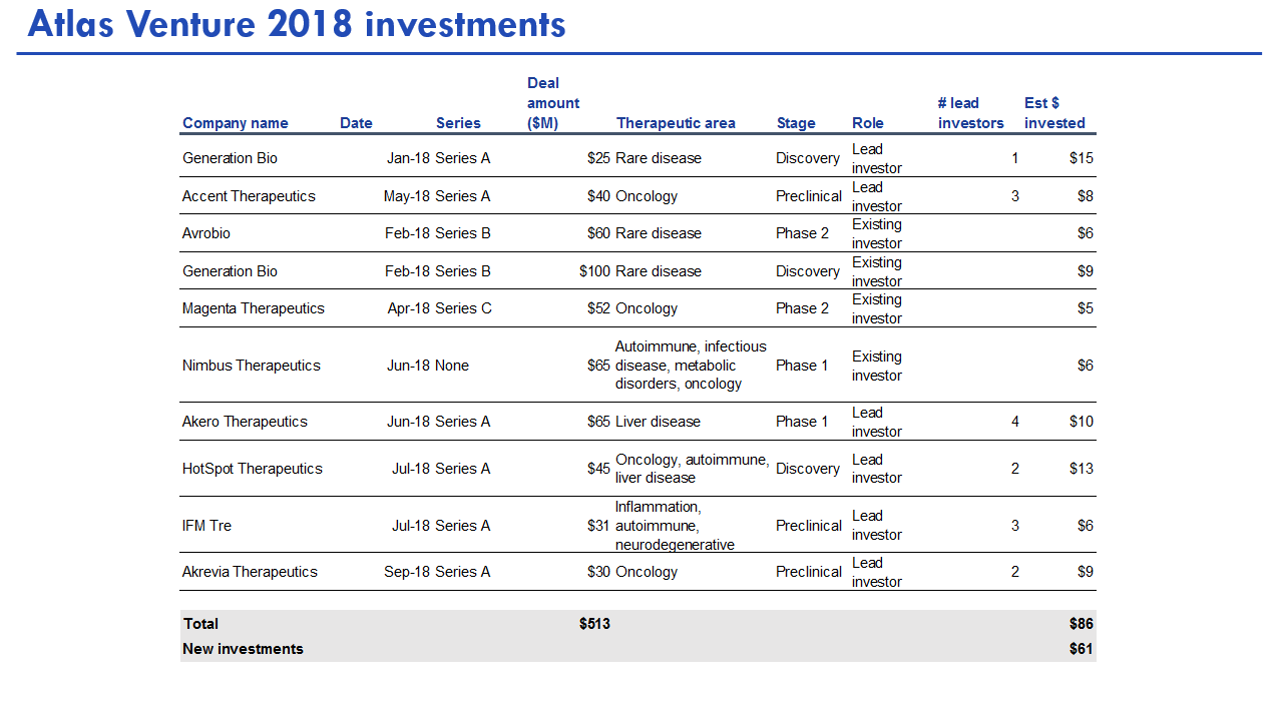
Succinct descriptions of hundreds of startups that raised venture money in 2018.
Target your partnering and funding strategy
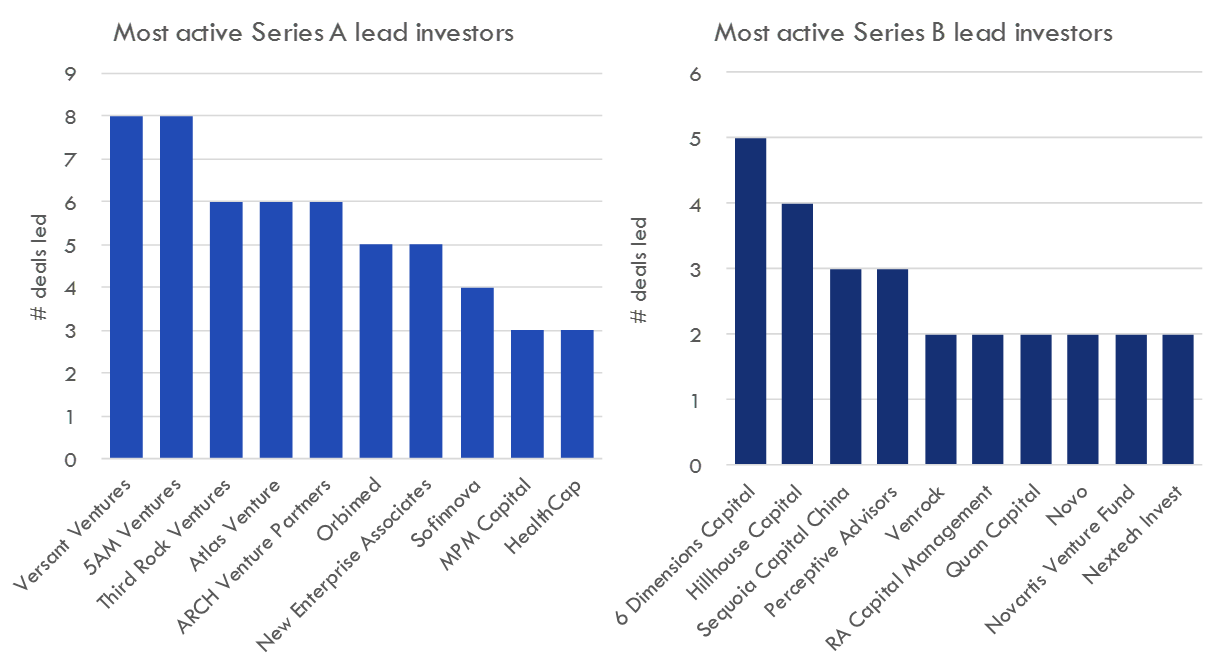
Quickly qualify leads. See who's leading Series A rounds, what companies are most likely to IPO in 2019, who's doing gene therapy partnerships, and more.
Know who's across the table
Digestible profiles of hundreds of startups and investors, including therapeutic areas and indications, cash proceeds and cash-on-cash returns for major investors in 2018 biopharma IPOs, 2018 deal activity and more.
See what drives value
Negotiate better deals with estimated private-round valuations for select companies. Benchmark your capital needs with data on historical R&D spend by research program for select companies.