Build DCF and rNPV models in the browser, and export to excel.
The process is simple:
- Add basic information about your pipeline.
- We auto-build a customized model for your pipeline, based on industry benchmarks.
- Review assumptions, adjust as needed, and observe the impact on valuation.
- Export your finished model in excel to share with your team.
Basic info
We'll start by adding basic info about your pipeline.
This will allow us to calculate your preliminary valuation range based on comparable companies.
First, add your company name and the last funding round ![]()
![]() you raised.
you raised.
Knowing the last funding round you raised allows us to better identify comparable transactions. For example, if you just raised a Series A round, we can provide valuations of comparable Series B companies to show how you might be valued in your next round.
| Category | Default value | Input |
|---|---|---|
| Company name (optional) | Therapeutics Company | |
| Last funding round raised (optional) |
Pipeline info
We'll start by adding basic information about your pipeline.
We use this information to estimate the probability of clinical success, cost of your clinical trials, and other items.
You can value one program with the free version. Adding products or indications requires a subscription
Product 1
| Category | Default value | Input |
|---|---|---|
| Product name | Product 1 | |
| Patent expiry year | 2047 | |
| Therapeutic modality | Product 1 | |
| Target | KRAS | |
| Indication 1 | Indication 1 | |
| Indication 1 stage | Target-to-hit |
Baseline valuation
The baseline enterprise value ![]()
![]() for companies with similar pipelines is
for companies with similar pipelines is
Enterprise value is a common measure of company valuation. The basic formula for enterprise value = value of company's equity + amount of company's debt - cash.
Don't worry if this preliminary value seems high or low -- it is just a starting point that will change throughout the process of building the model.
How do we calculate this?
We use a DCF analysis ![]()
![]() that is pre-populated with industry benchmarks. We select benchmarks based on companies with pipelines like yours.
that is pre-populated with industry benchmarks. We select benchmarks based on companies with pipelines like yours.
DCF analysis is a common technique for valuing companies. A DCF values companies as the sum of all the cash the business is expected to generate in the future.
Next, we will review these placeholder assumptions to make sure the model captures the value of your company.
How to review the model
We've seeded the model with industry benchmarks. For many inputs, these benchmarks are fine as-is.
But there are some assumptions that you'll want to customize. The more that you research the right assumptions for your business, the better the model will capture your company's true value.
We will walk through these assumptions, roughly in order of importance. You can jump around at any time by clicking the categories in the left column.
At any time, you can click Update valuation in the lefthand column to see your current valuation.
When you are done with your inputs, click Get valuation report to see an analysis of your valuation. You can also download an excel version at any time.
If you have questions, feel free to email us. Let's get started!
Pipeline R&D costs
Now we will review the assumptions driving the model, and the data supporting those assumptions.
For the p(TS) assumptions, we have selected one study (highlighted below in yellow) as the most appropriate for each of your products ![]()
![]() . The model uses the data from these studies as inputs.
. The model uses the data from these studies as inputs.
We use Thomas 2021 in most cases, as it is the most recent study and is a sizable study. Wong 2018 is a larger study, but less recent. The other studies are provided for reference, but as they are less recent, should only be used if there is a specific rationale for choosing the study (for example, a study may have p(TS) data for a specific indication that others do not include).
Some studies include p(TS) by therapeutic area and / or therapeutic modality. We generally prioritize p(TS) data by therapeutic area over therapeutic modality, although you can make a case for either.
To see additional studies that may also be suitable for your pipeline, click "see more studies" below.
To edit the assumptions in the model, click "edit assumptions" below.
Hide edit assumptions -
Hide edit assumptions -
Product 1
Indication 1
| Category | Default value | Input |
|---|---|---|
| Target-to-hit cost | $2.1M | |
| Target-to-hit time | 1 years | |
| Target-to-hit p(TS) | 80% | |
| Hit-to-lead cost | $5.3M | |
| Hit-to-lead time | 2 years | |
| Hit-to-lead p(TS) | 75% | |
| Lead optimization cost | $21.0M | |
| Lead optimization time | 2 years | |
| Lead optimization p(TS) | 85% | |
| Preclinical development cost | $10.5M | |
| Preclinical development time | 1 years | |
| Preclinical development p(TS) | 69% |
Indication 1
| Category | Default value | Input |
|---|---|---|
| Phase 1 cost | $34.7M | |
| Phase 1 time | 2 years | |
| Phase 1 p(TS) | 60% | |
| Phase 2 cost | $80.4M | |
| Phase 2 time | 2 years | |
| Phase 2 p(TS) | 36% | |
| Phase 3 cost | $350.2M | |
| Phase 3 time | 3 years | |
| Phase 3 p(TS) | 62% | |
| FDA submission cost | $54.9M | |
| FDA submission time | 1 years | |
| FDA submission p(TS) | 90% |
Human studies
Prehuman studies
If a stage does not apply to your product (i.e. getting accelerated approval post-Phase 2 and skipping P3), enter 0 for the time and cost of the stage, and 100% for p(TS))
Peak sales projections
The items in this section are used to calculate how much revenue your programs will generate.
The model benchmarks your peak sales based on drugs with the same therapeutic area. It assumes a price per year of $150,000, and then calculates peak patients by dividing peak sales by $150,000.
You can change the assumptions for peak patients and annual price per patient below.
If you haven't already researched the patient population for your programs, you'll need to do that now. If you aren't familiar with how to do these revenue builds, click the tooltip icon for more info ![]()
![]() .
.
Revenue build basics
Most drug companies forecast revenue by estimating the size of the eligible patient population, the number of years it takes to reach "peak" sales, and the projected pricing.
A simple way to forecast pricing is to look at the price of comparable drugs. For time to peak sales, most drugs reach peak sales 5-7 years after launch.
Calculating peak patients is a bit more involved. The basic steps are:
- Start with the population of your geography of interest (ie # of people in the US)
- Then layer on the epidemiology data – incidence and prevalence – to estimate how many of these people have the disease. You can get this data from scientific publications, or subscription databases like Datamonitor or Global Data.
- Then layer on any filters for subpopulations – are you targeting patients who have failed two previous lines of therapy? Patients with a particular genetic mutation? Patients exhibiting certain symptoms? Ultimately the eligible patient population will be determined by the label that FDA approves for your drug based on your clinical studies.
- Then filter for accessible patients. How many of these patients are diagnosed? How many see a doctor regularly? How many have insurance that will cover the treatment?
- Then filter for how many patients will be treated with your drug (taking into account other drugs / procedures that could treat patients). The more competing products, the smaller your share (unless your product is very differentiated).
Hide edit assumptions -
Product 1
Revenue
| Category | Default value | Input |
|---|---|---|
| Price in year product is launched | $50,000 | |
| Annual price increase % | 5% |
Product 1
Indication 1
| Category | Default value | Input |
|---|---|---|
| Peak patients treated / year | 50,000 | |
| Years from launch to peak sales | 5 years |
Costs and expenses
This section covers expenses.
This includes standard income statement items like Cost of Goods Sold (COGS), Selling, General and Administrative expenses (SG&A), and taxes, as well as biopharma-specific items like Gross-to-net discount, platform R&D and launch costs.
With the exception of platform R&D, these assumptions come from industry benchmarks. Gross-to-net discount values may be higher than 10% for many drugs, especially higher priced products.
Hide edit assumptions -
P&L costs and expenses
| Category | Default value | Input |
|---|---|---|
| COGS % of sales | 10% | |
| Gross-to-net discount | 10% | |
| SG&A % of sales | 30% | |
| Tax rate | 20% |
Annual platform R&D
Calculated as max of 1) % of sales or "Platform R&D in year 1" * growth rate
| Category | Default value | Input |
|---|---|---|
| Platform R&D in year 1 ($M) | $10M | |
| Annual % growth in platform R&D | 5% | |
| Platform R&D % sales | 5% |
Launch costs (SG&A)
Launch costs are in addition to the SG&A expense defined above. Launch costs are based on industry benchmarks.
Product 1
Indication 1
| Category | Default value | Input |
|---|---|---|
| 3 years before launch ($M) | $25M | |
| 2 years before launch ($M) | $35M | |
| 1 year before launch ($M) | $75M | |
| Launch year ($M) | $100M | |
| 1 year after launch ($M) | $100M |
Cash flow and general corporate info
This is the last step! These assumptions are used to calculate your enterprise value, equity value, price per share, runway and other valuation metrics.
Don't worry too much about depreciation and working capital items. These are accounting items that are required for the DCF, but generally won't vary too much across companies.
Your capex assumptions can come from your own internal projections, or you can use our benchmarking data. One of the major variables impacting capex is whether you plan to build your own manufacturing, like many gene and cell therapy companies do.
One item deserving attention is platform value. This reflects the value of your company's technology that is not captured by specific pipeline products. It is difficult to value platforms. A common technique is to estimate platform value based on the enterprise value of comparable preclinical companies, but this is a very inexact technique. Another approach is to estimate the amount of new programs the platform can generate per year, and estimating the NPV of each program, but this method is also inaccurate and relies on highly uncertain assumptions.
The discount rate assumption is also very important. A discount rate of 10% is only appropriate for later-stage, mature companies. Small-mid-cap public companies may use discount rates of 12-18%, and higher discount rates may be appropriate for private companies.
General corporate info
| Category | Default value | Input |
|---|---|---|
| First forecast year | 2023 | |
| Discount rate | 10% | |
| Current cash balance ($M) | $0M | |
| Current debt ($M) | $0M | |
| Current shares outstanding (in millions) | M | |
| Platform value | $100M |
Capex and depreciation
Capex calculated based on % of sales post-approval; otherwise grows at fixed rate per year
DCF does not include terminal value
| Category | Default value | Input |
|---|---|---|
| Capex in year 1 | 1.0 | |
| Capex annual growth rate | 5% | |
| Capex % of sales | 1% | |
| PP&E useful life (years) | 10 | |
| PP&E salvage value as % of original value | 20% |
Working capital
| Category | Default value | Input |
|---|---|---|
| Accounts receivable % sales | 15% | |
| Inventory % of COGS | 4% | |
| Prepaid expenses % SG&A | 1% | |
| Other current assets % sales | 1% | |
| Accounts payable % COGS | 20% | |
| Accrued expenses & SG&A | 12% | |
| Other current liabilities % sales | 1% |
Valuation report
See the rightmost column for an analysis of your business' valuation and financials.
Click on each row to expand or hide the details.
Valuation overview -
Bottom of comps range
Low end of comps range
Middle of comps range
High end of comps range
Top end of comps range
Valuation football field
We use a "football field" to show the valuation ranges from a variety of comparable companies.
Click on the bars in the chart to see the underlying data (this will open a new window).
This chart shows four sets of comparable companies. These are common techniques used by biotech investors to value companies.
- Private round comps: valuations of similar private companies. This is useful for valuing private companies. However, these prices may not accurately reflect the current down market, as the volume of investments is down significantly. Further, many companies are holding off on raising or raising insider-led bridge rounds, so our database is enriched for pre-crash valuations. This method applies a "hurdle rate" to account for the fact that not all companies will IPO.
- IPO comps: valuations of similar companies at the time of their IPO. This can be useful for valuing private companies when there is an active IPO market. This technique is less reliable when the IPO market is colder (as it has been since late 2021).
- M&A comps: valuations of similar companies that were acquired. This technique can be used to value public or private companies. Because not every company is acquired, this technique divides the average value of acquired companies by a "hurdle rate" to account for the fact that most companies won't get acquired. Pre-crash, the hurdle rate was often 4-6x (although this range overstates the actual probability of being acquired).
- Public equity comps: valuations of similar public companies. This methodology is most reflective of changing market conditions, as it is based on the daily closing prices of public companies. For private companies, we apply an industry-standard 30% discount to account for the lack of liquidity in private shares.
Other key valuation stats
Enterprise value:
Current cash lasts through:
Equity value:
Price per share:
Valuation analysis +
What are the biggest value inflection points?
The below chart shows how your company's value grows as you progress towards FDA approval. Knowing what events drive the most value can help you figure out the best time to partner or fundraise, and how to allocate resources internally.
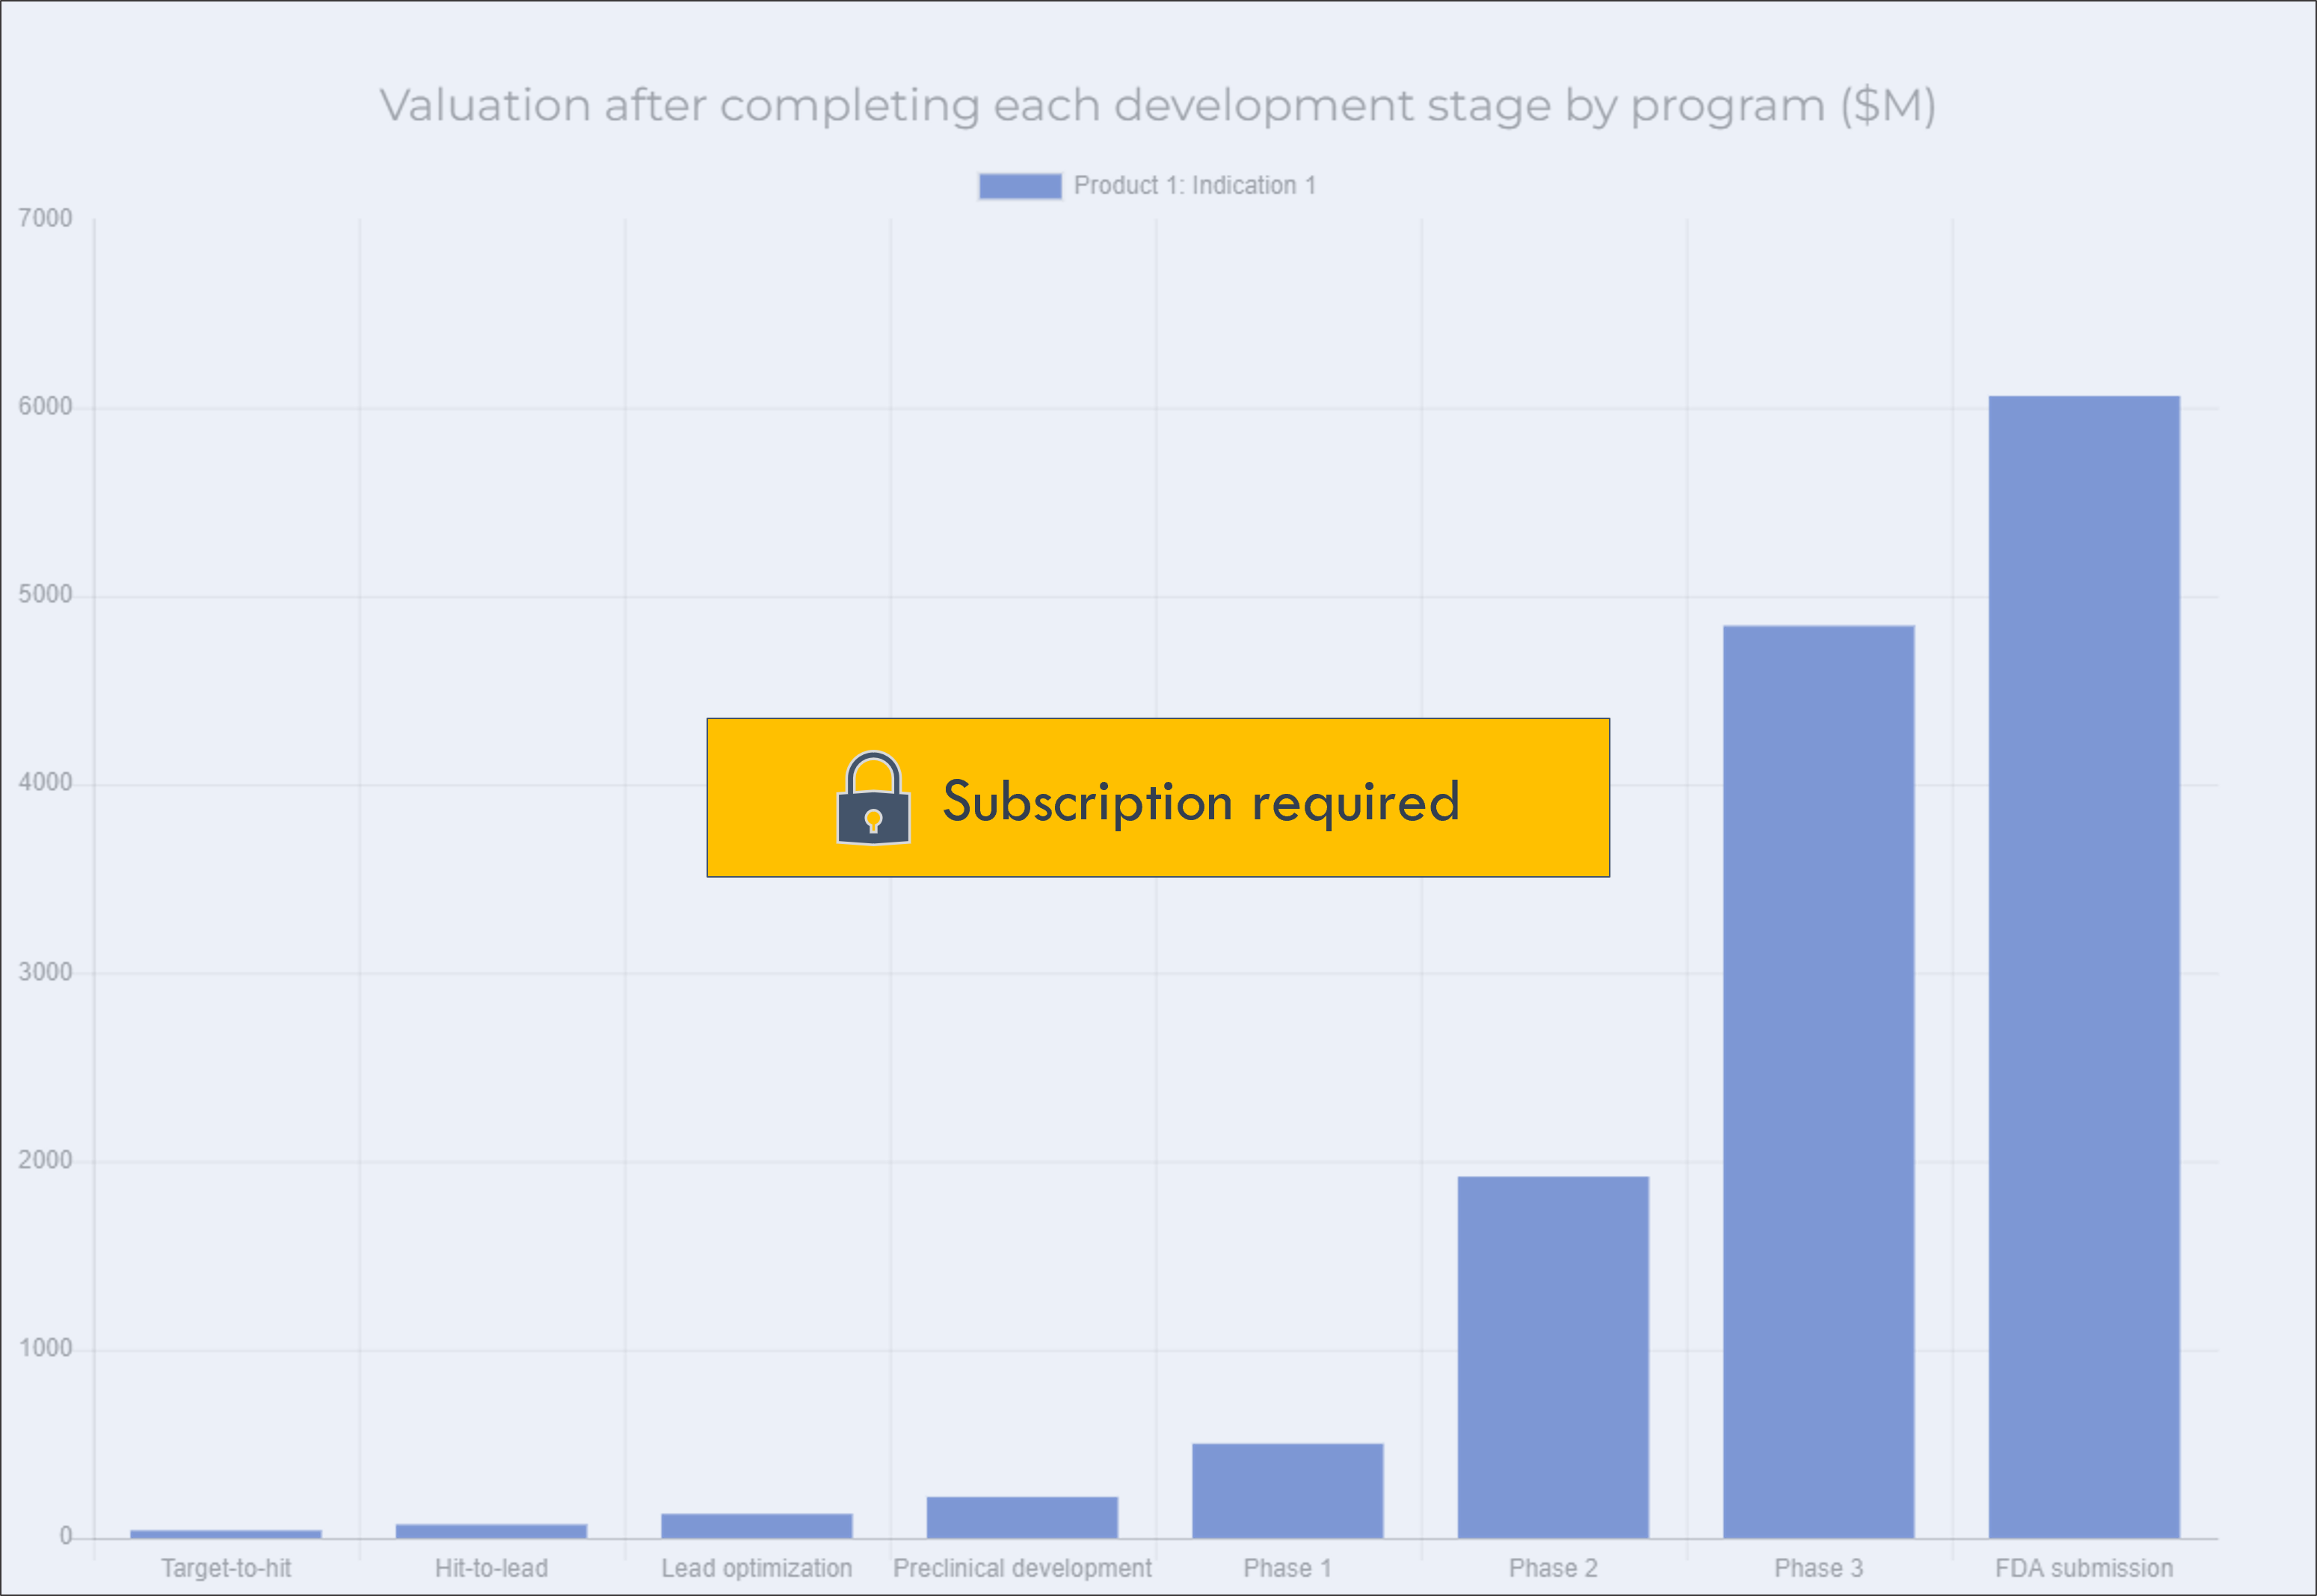
This chart shows the value of each program as it progresses through each development stage. This provides a picture of how the company's value will grow over time.
The value in each bar represents the company's value if the company "fast-forwarded" to that stage. This can help understand when is the right time to partner or sell an asset, or raise money: for example, it may be worth waiting to partner a program until completing a certain stage, if the program becomes much more valuable after completing the stage.
This excludes general corporate expenses.
If a program has already completed a given stage, there will be no data for that stage in the chart (for example, a Phase 2 program will not have any data for value at Preclinical development).
Click on a program in the legend to show or hide the program in the chart.
Which programs drive the most value?
The below chart shows how much each program contributes to your total enterprise value.
Total company valuation includes the value of each program plus general corporate spend (platform R&D, capex, working capital, etc).
Which variables drive the most value?
Valuation models are very sensitive to specific assumptions. A small change in one variable may lead to a big change in your valuation.
You can perform a simple sensitivity analysis to see how changing certain variables impacts your valuation.
Choose two variables to analyze. Then select a range of values to test.
Current value
New value 1
New value 2
New value 3
New value 4
New value 5
Current value
New value 1
New value 2
New value 3
New value 4
New value 5
$ in millions, except drug price
Funding need and value inflection +
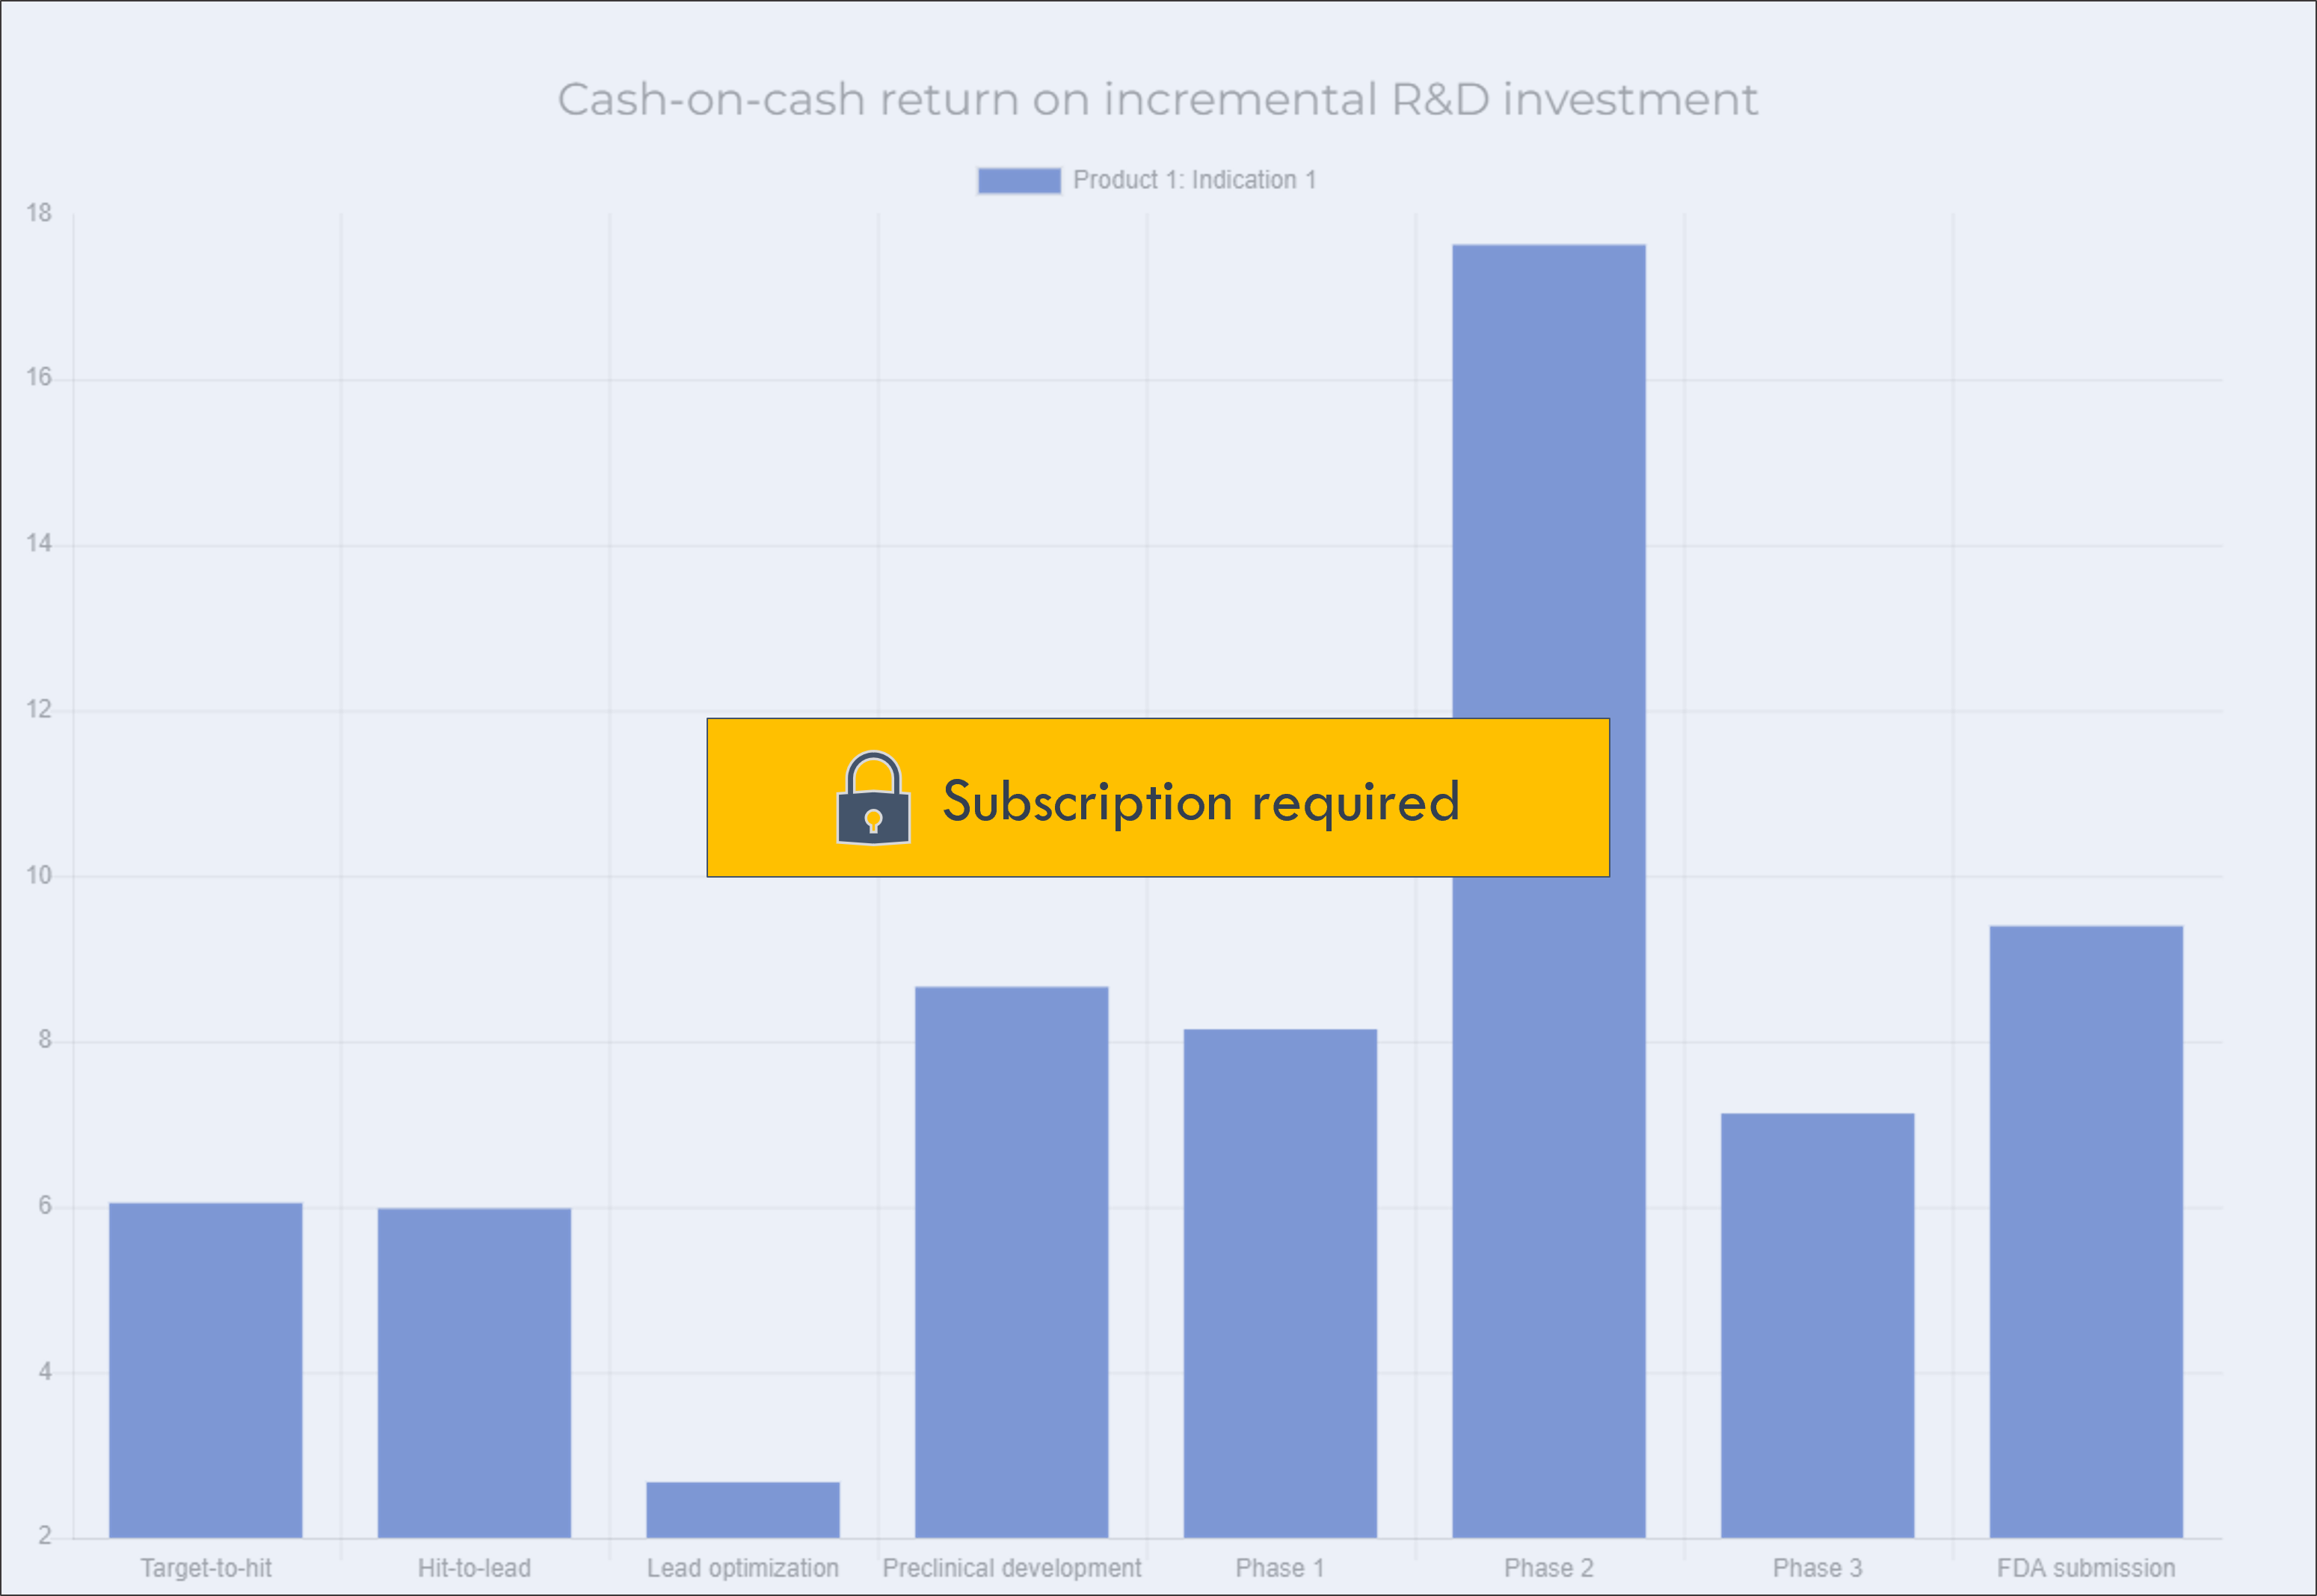
This chart shows the return on investment of each development stage. It shows the increase in valuation after completing a stage divided by the total cost of funding the stage.
This information can be used to plan investment and fundraising strategy. Prioritizing investments with high near-term value inflection enables you to raise funding on better terms, which can be used to fund programs with longer-term value inflection.
This excludes general corporate expenses.
If a program has already completed a given stage, there will be no data for that stage in the chart (for example, a Phase 2 program will not have any data for value inflection at Preclinical development).
Click on a program in the legend to show or hide the program in the chart.
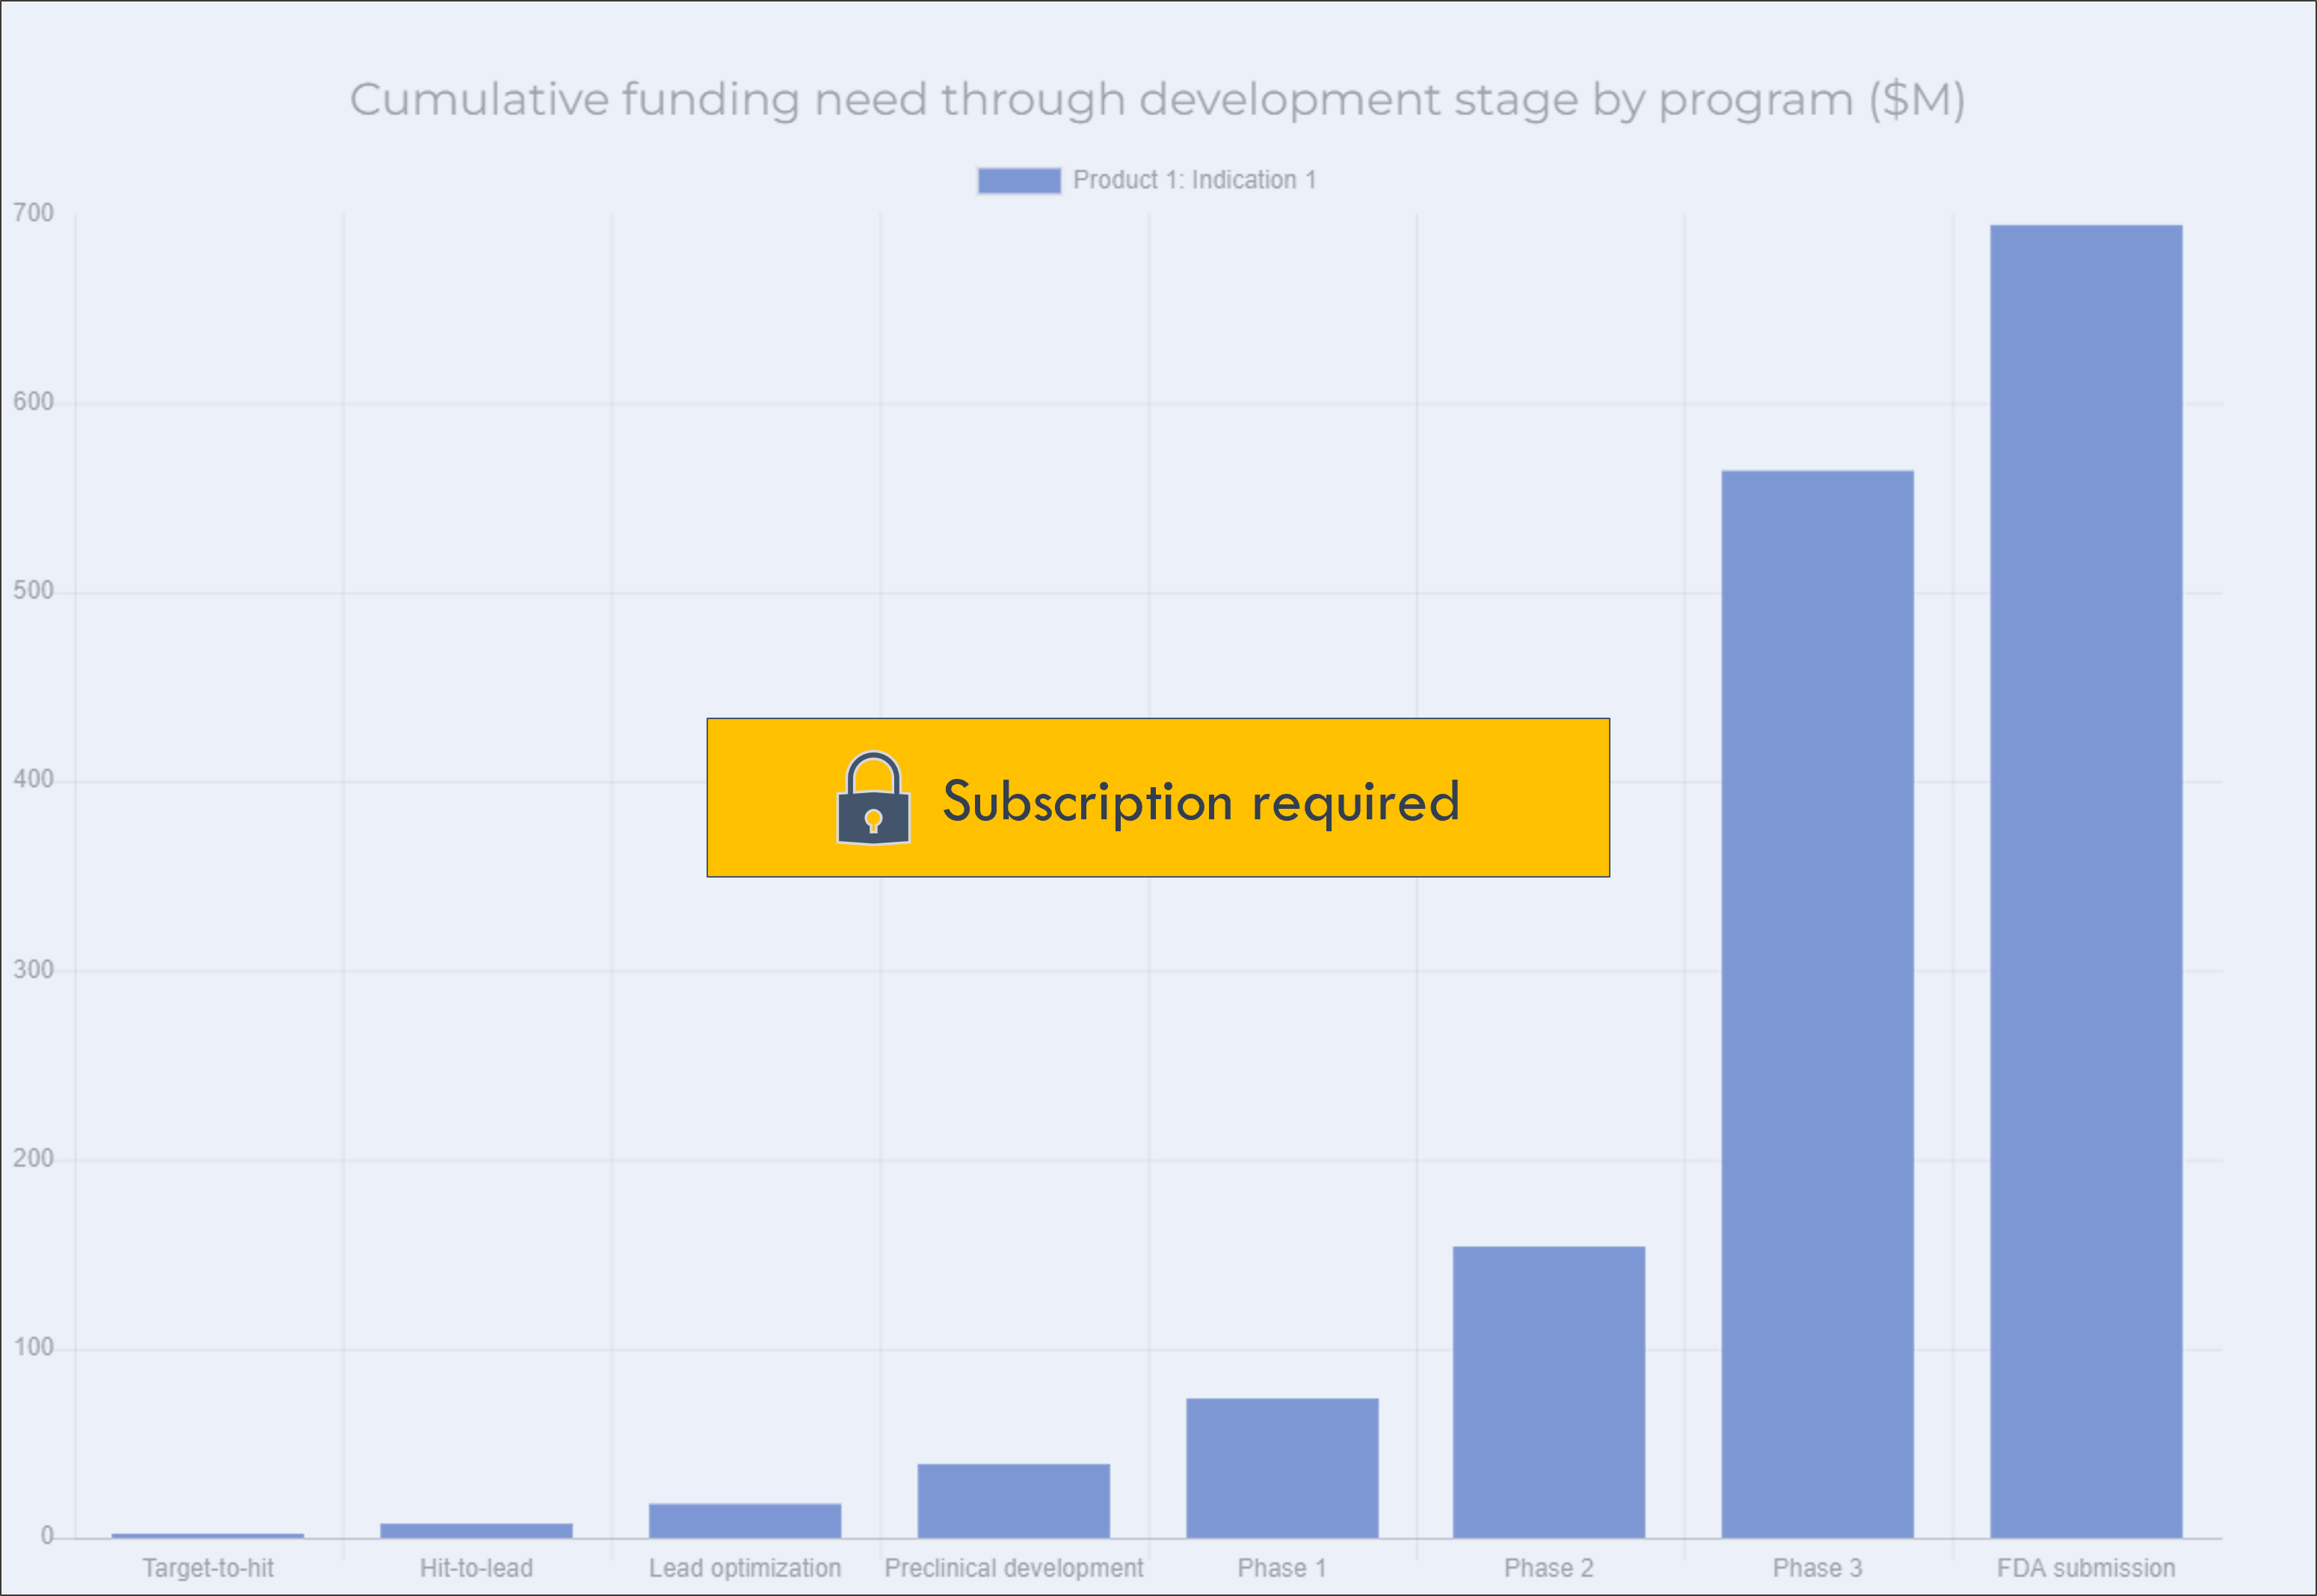
This chart shows the cumulative funding need through each development stage.
This excludes general corporate expenses.
If a program has already completed a given stage, there will be no data for that stage in the chart (for example, a Phase 2 program will not have any data for funding need through Preclinical development).
Click on a program in the legend to show or hide the program in the chart.
Funding need to profitability only includes program-specific spend, and excludes general corporate spend like platform R&D and capital expenditures.
Financial projections +
This shows annual net revenue by program. Net revenue equals gross revenue less gross-to-net adjustments.
Click on a program in the legend to show or hide the program in the chart.
Operating income by program does not include general platform R&D or other general corporate expense.
Click on a program in the legend to show or hide the program in the chart.
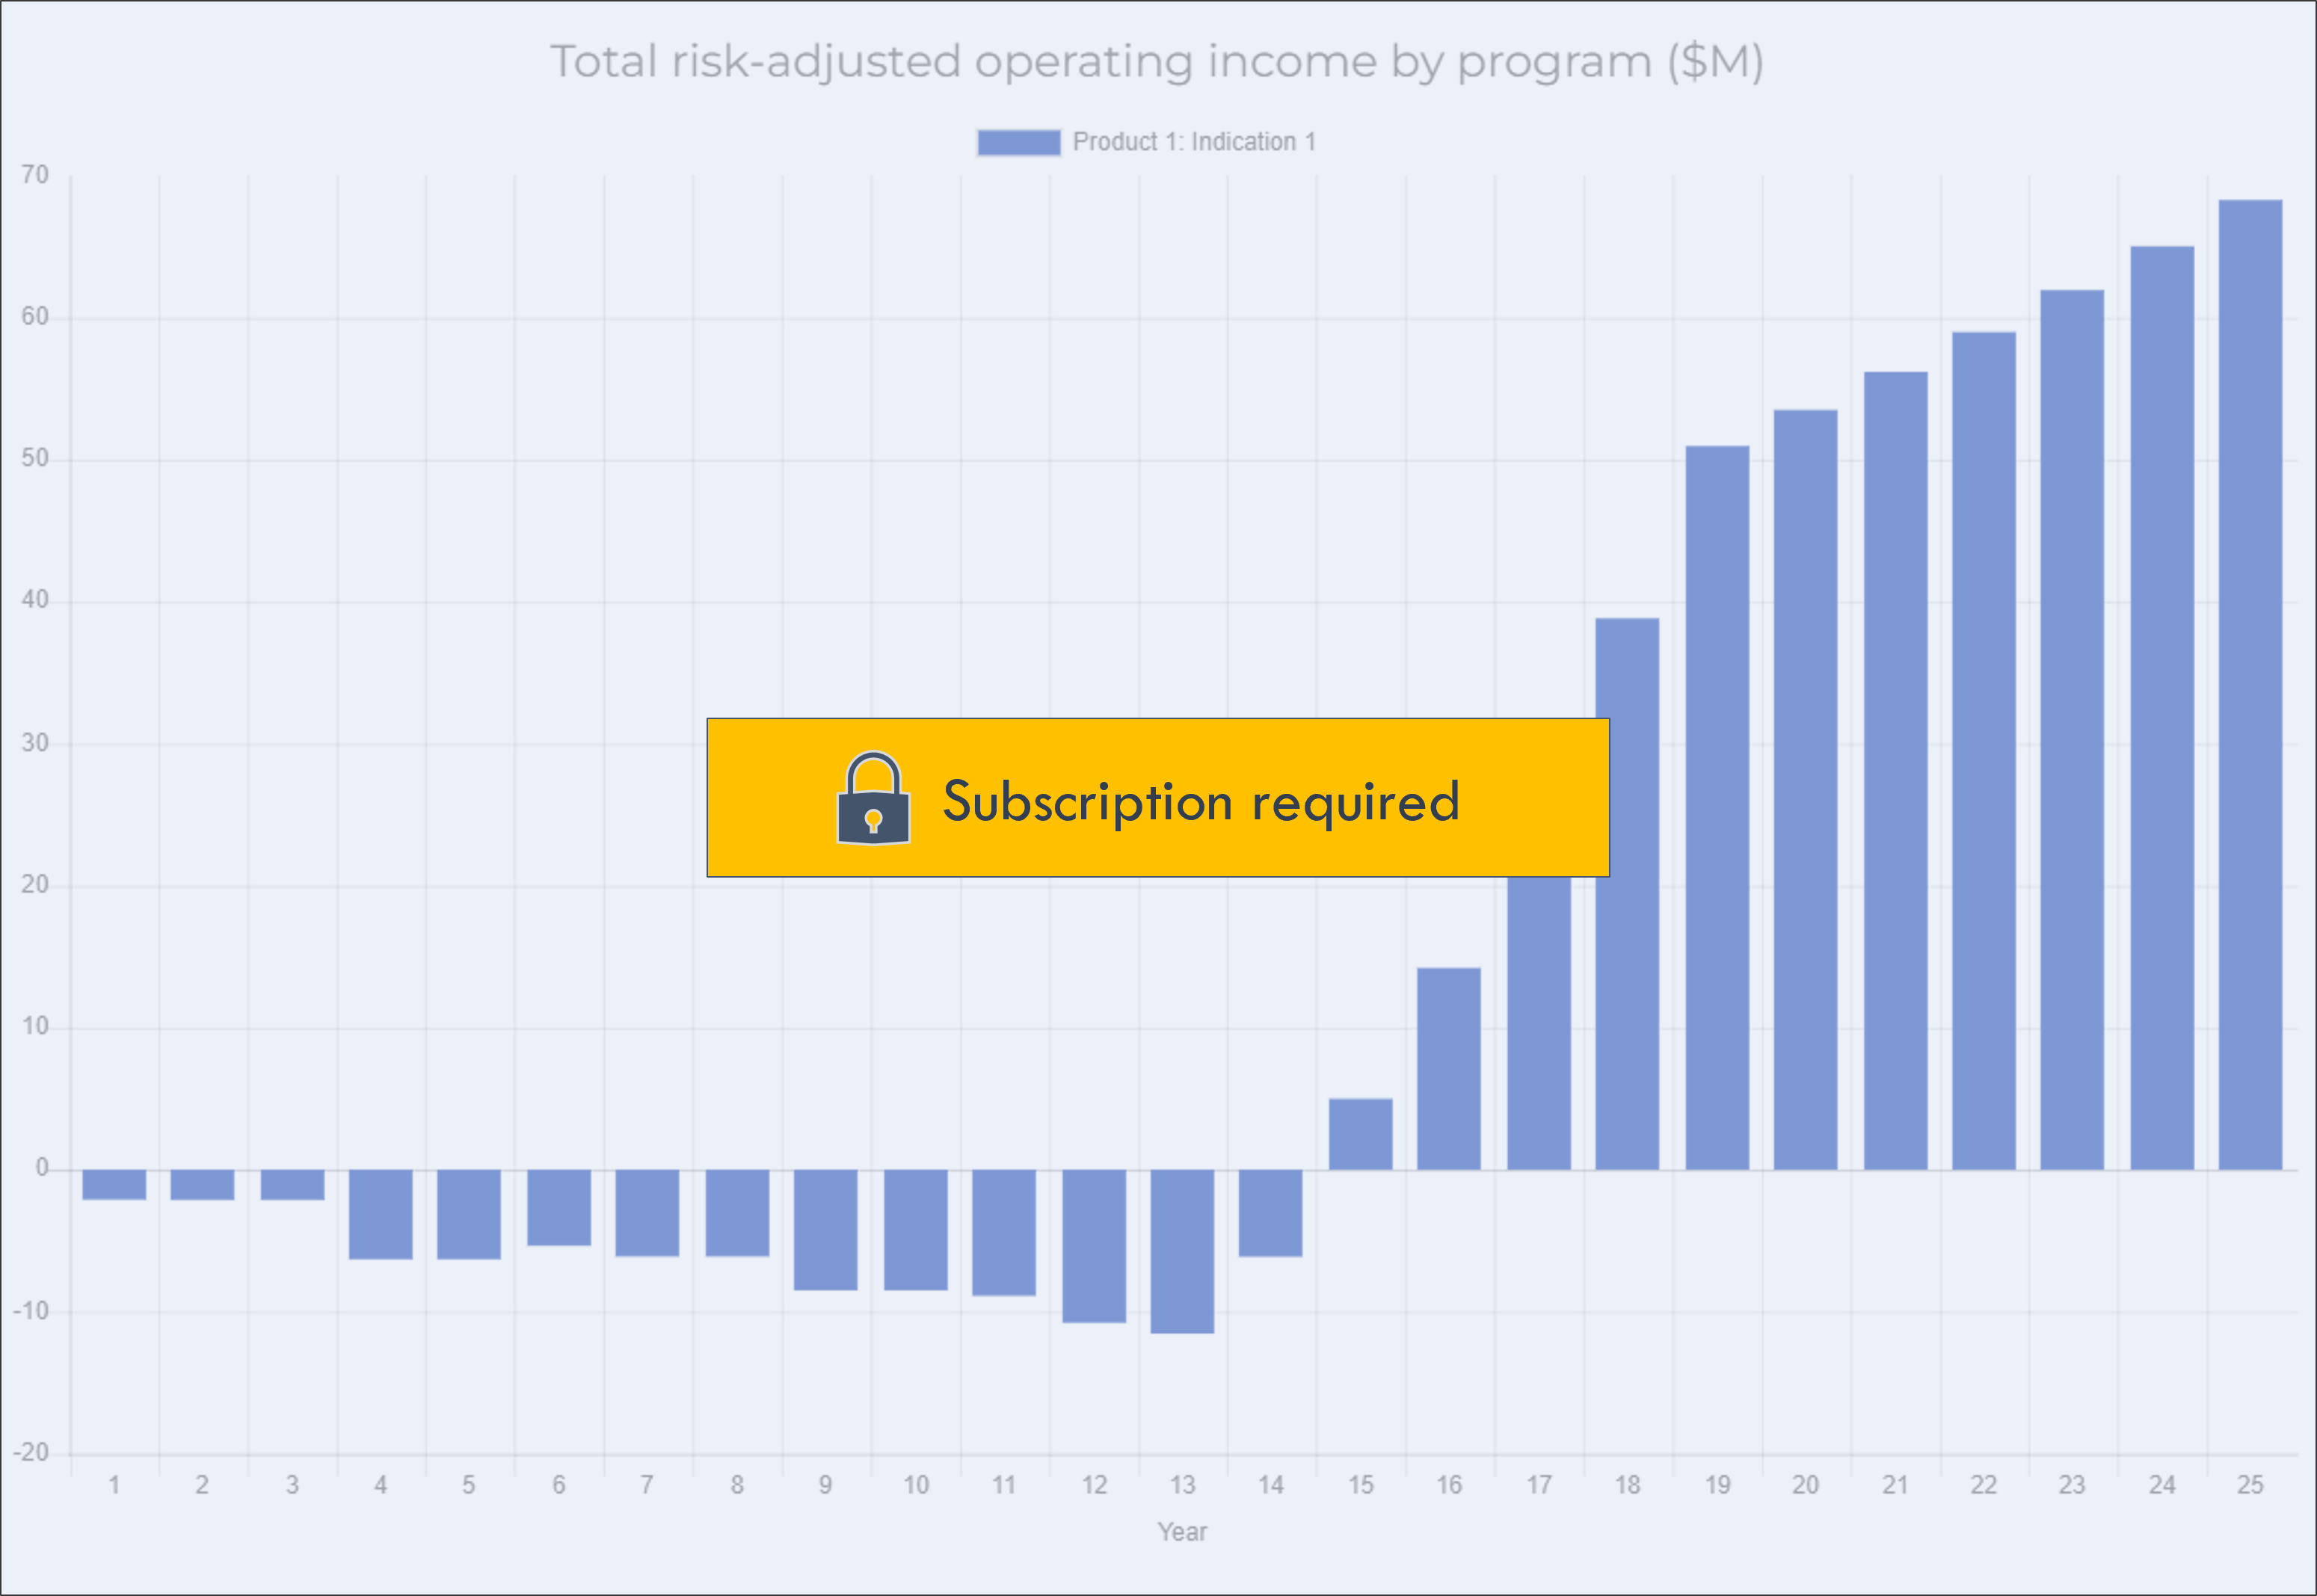
Risk-adjusted net income adjusts net income by the probability of that income occurring. This accounts for the technical risk of each development stage.
Click on a program in the legend to show or hide the program in the chart.
DCF overview
$ in millions, except drug price