Are startups 5x better at R&D than big pharma?
Richard Murphey
A recent Deloitte report presents some interesting numbers on pharma R&D productivity: a group of 12 large cap pharma companies generated returns on R&D investment of only 1.9% in 2018. An extension cohort of four smaller companies generated a return of 9.3% on R&D.
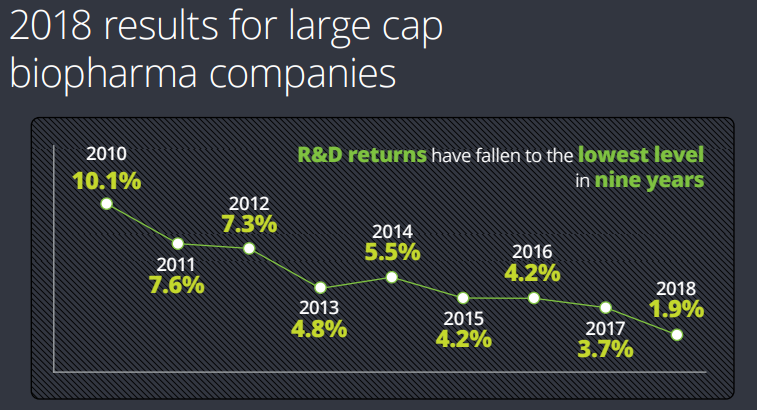
This is an interesting finding. But the extension cohort consisted of just four companies – hardly representative of R&D productivity at small companies as a whole.
In this post, I’ll examine recent data on FDA approvals and R&D spend at big companies vs. startups to see if startups really are much better at R&D than their big pharma counterparts.
This is a back-of-the-napkin analysis based on the limited publicly available data I could find. But the results are interesting and merit further, more rigorous examination. I'll discuss my methodology more below.
Why this matters
Big pharma's revenues were decimated during the "patent cliff" earlier this decade. At the same time, big pharma's internal R&D engine was failing to generate enough innovative new products to replace this lost revenue. In recent years, big pharma has increasingly relied on partnering with or acquiring startups to access new products.
This strategy is only sustainable if startups are better at R&D. Otherwise, pharma is just transferring R&D spend from its income statement to balance sheet, which isn't sustainable.
Fighting Eroom's Law
I’ll evaluate R&D productivity by looking at R&D dollars spent per FDA approved drug. This is the basic methodology used in some of the early papers on “Eroom’s Law”.
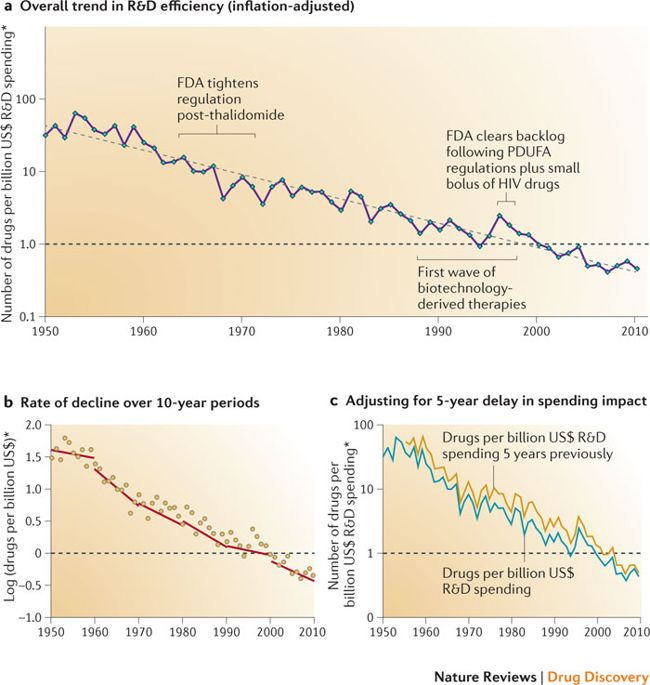
“Eroom’s Law” is “Moore’s Law” backwards, and applied to pharma instead of semiconductors. It states that we are getting much more efficient at various specific parts of the drug development process – in some cases, these efficiency gains approximate Moore’s Law – but the overall cost of drug development is nonetheless increasing at an exponential rate.
A 2012 Nature Reviews Drug Discovery paper by Scannel et al illustrates this phenomenon:
We can compare the dollars invested per approved drug developed by startups to the dollars invested per approved drug developed by big pharma to compare R&D productivity.
For this analysis, we will need:
- A sample of approved drugs
- Data on whether these drugs were developed by big pharma or startups
- Data on when these projects were initiated (their “vintage”) and how much startups and big pharma spent on R&D during that “vintage year”
Then we can divide the number of approved drugs developed by startups by the R&D spend required to develop these drugs to get NMEs approved per billion dollars of R&D spend (an NME is a "new molecular entity"). We can do the same for big pharma, and compare the results.
We'll start by looking at the number of drugs approved by startups and big pharma, then calculate the R&D spend required to develop those drugs. Finally, we will compare R&D productivity.
Small companies discover and develop more new drugs than big pharma
An HBM New Drug Approvals report shows that small pharma companies now invent most FDA-approved drugs:
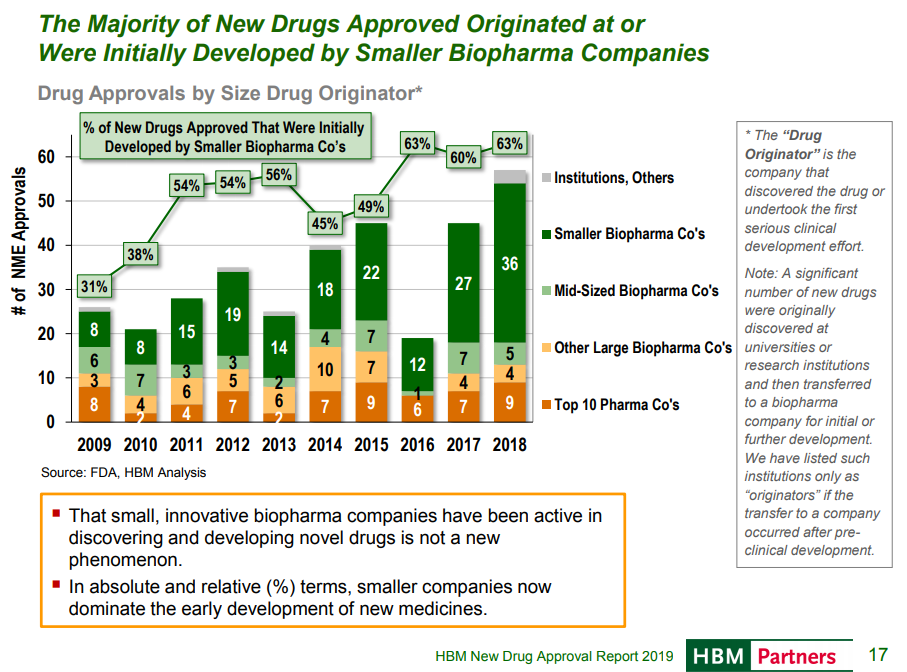
We see that a smaller and smaller share of new drugs come from big pharma. Big pharma and large biotech companies have discovered 10-12 new approved drugs a year for the past decade. Small companies developed 10-15 new approved drugs a year until the last few years, where they have rapidly increased the number of approved drugs coming from their labs.
This chart shows what kind of firms “originate” drugs that are ultimately approved. It’s important to note what is meant by “originating” here. HBM defines “originator” as the group that “discovered the drug or undertook the first significant clinical development effort”. So “originator” has a very wide range of definitions: it could be the company that discovered the drug, or the company that took it into Phase 1. Universities, startups and pharma often collaborate closely at various stages, so it’s hard to attribute accomplishments to one group or another in many cases. So it probably makes sense to have some leeway in defining who the “originator” is, but it still would be nice for more clarity.
A more objective metric is looking at what company owned a drug at time of FDA approval:
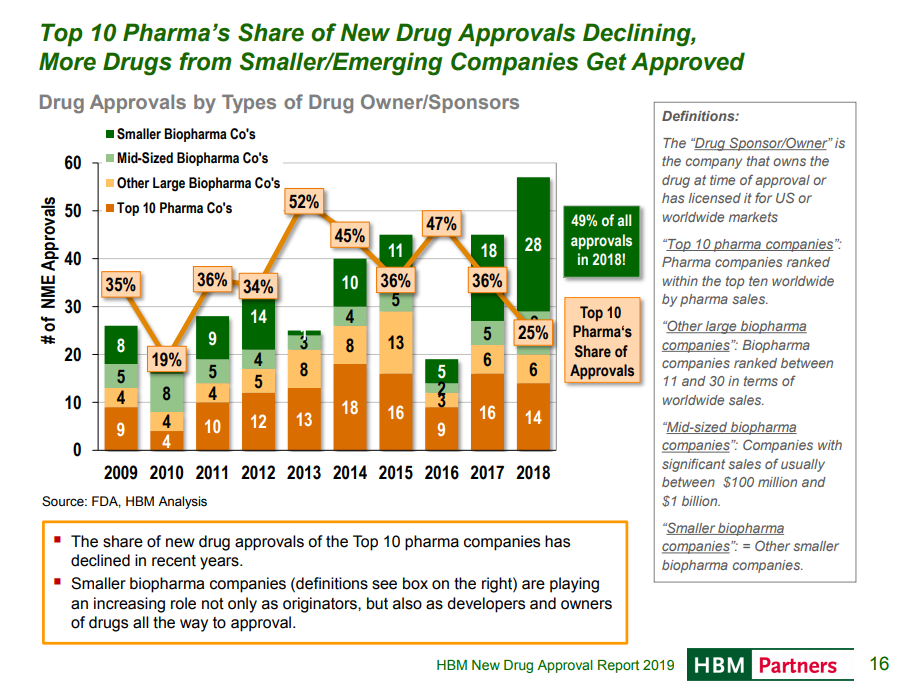
The prior chart showed who “originated” drugs that were approved by FDA in a given year. This chart shows who “owned” the drug at the time of approval. This is less subjective, as the sponsor of the application is public knowledge, although the sponsor of a drug submission did not necessarily do much work discovering or developing the drug.
For example, if a startup spends 10 years developing a drug and completes all required studies, and then a big pharma company buys the startup and submits the drug for FDA approval, the big pharma company would be listed as the “owner”. Since many startups take drugs through phase 1 or 2 and then sell to big pharma (or even sell at preclinical stage), this analysis does not reflect which kind of company did the brunt of the R&D work.
Startups vs. small companies
But some of these small companies are fairly established and aren't really "startups". HBM defines "smaller" companies as any company with revenue less than $100M -- this certainly includes companies that wouldn't be considered startups.
To narrow the dataset down to true startups, I manually researched the development history of the drugs approved in 2018. I defined “startup” as a company that receives venture capital funding. Because it takes a long time to approve a drug, I classified companies as startups if they received venture capital in the last 15 years. This is a somewhat arbitrary number, but because the process of starting a drug discovery process to FDA approval takes an average of 14 years, I thought this was appropriate.
My analysis shows that 19 of the new drugs approved in 2018 were developed by companies that received VC funding in the last 15 years. Thus 32% of 2018 newly approved drugs were developed by startups, per my definition of startup.
So that’s our figure for number of new drugs developed by startups. How many drugs approved in 2018 were developed by big pharma?
We don’t need to do any additional research for this, as HBM defines this category for us. HBM provides data on the top 30 biopharma companies (including the two categories “top 10 pharma companies” and “other large biopharma companies”). I’ll define big pharma as the top 30 biopharma companies per HBM. The top 30 big pharma companies originated 13 of the novel drugs approved in 2018.
Comparing early-stage R&D spend between big pharma and startups
Now we have the number of drugs approved in 2018 that were originated by startups vs. big pharma. Next we need to calculate the amount spent on R&D by big pharma and startups.
There are three challenges here:
- We need to include R&D spend on failed R&D efforts, not just successful ones
- We need to account for the fact that big pharma spends on early-stage and late-stage R&D, while startups generally only spend on early-stage R&D
- We need to define a time period for our calculation of R&D spend. Some drugs were approved 5 years after they were originated, others were approved 15 years after they were initiated.
For the first challenge: we can do this fairly easily for the big pharma companies. PhRMA, the big pharma lobbing group, discloses total annual R&D spend by its members. Because the set of 36 PhRMA members overlaps considerably with HBM’s list of the top 30 R&D companies by sales, this seems like a reasonable “quick and dirty” analysis.
This analysis is more difficult for startups, but a good approximation is to use the amount of venture capital invested in startups. Our definition of “startup” is a company that is financed by venture capital, so this seems reasonable. Ideally we would also include proceeds from IPOs or other public stock offerings for some companies, but this is complicated because not all biopharma companies that raise public equity are startups.
However, using venture capital invested overstates R&D spend. Venture capital finances not just a startup’s R&D spend, but also the general and administrative costs of the business. Paul et al calculates that 20% of venture capital supports these general and administrative expenses as opposed to R&D. We will account for this in our calculations.
The second challenge is creating an apples-to-apples comparison of startup and big pharma R&D. We only want to compare early-stage R&D spend, because startups do not typically engage in expensive late-stage R&D that big pharma companies do. Fortunately, PhRMA discloses spend by development stage for its members. Startups are typically acquired during mid or late-stage studies, so startup R&D spend can be approximated as spending on preclinical through Phase 1, or as spending on preclinical through Phase 2.
The final challenge is defining a fixed time period for our calculation of R&D spend. Other analyses, such as Kelvin Stott’s analysis of R&D productivity over time, address this by choosing an “average” year of spending to represent the total period of R&D investment. For example, Paul et al 2010 in Nature Rev Drug Disc shows the average years from initiation of a drug program to FDA approval is 14 years. The “investment year” is the midpoint of the R&D period, so year 7. Stott shows that the overall return on investment is robust to changes in this assumption.
We can use a similar approach adapted to our goals. We can use 14 years as the duration of the R&D phase from Paul et al 2010 (as Kelvin Stott did). Because we are only looking at early-stage investments, we should only consider the early-stage R&D period: target-to-hit through Phase 1 or 2. This period represents 7-10 years. The midpoint of this period is 4-5 years. So our “investment period” is 4-5 years, and drugs are approved on average 9-10 years after our investment period. If we are using 2018 as our approval year, our investment year will be 2008 or 2009.
Calculating R&D productivity
Now that we have our data sources and methodology, we can do our calculation.
In 2008, venture capital funds invested $5.1B in biopharma startups. Recall that only 80% of venture investment in biopharma goes to R&D. Therefore in 2008, startups spent $4.1B on R&D.
What about big pharma? In 2008, PhRMA members spent the following on R&D:
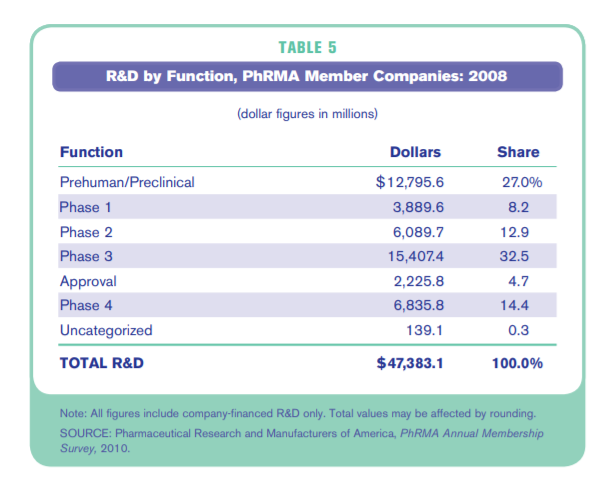
So big pharma spent $16.7B on preclinical through Phase 1, and $22.8B on preclinical through Phase 2. We will use the average of these two figures: $19.8B. This is because roughly half of startups are acquired in early clinical studies and half are acquired in later-stage studies.
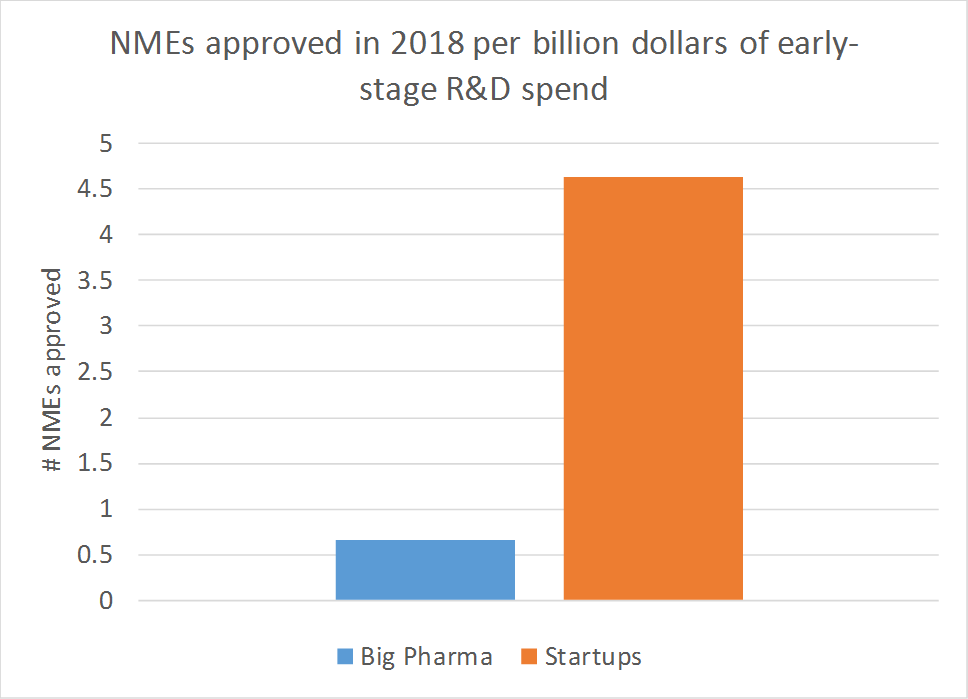
Now we can calculate NMEs approved per $1B in early-stage R&D spend. Here are the numbers for our calculation:
- Novel drugs approved in 2018 that were originated at startups: 19
- Novel drugs approved in 2018 that were originated at big pharma: 13
- Startup R&D spend in 2008: $4.1B
- Big pharma early-stage R&D spend in 2008: $19.8B
This gets us 4.5 new drugs approved (NME = new molecular entity) in 2018 per billion dollars of startup early-stage R&D spend, and 0.7 new drugs approved per billion dollars of early-stage spend at big pharma.
This is just a back-of-the-envelope analysis, and further research is required to more fully test the hypothesis that startups are better at R&D than big pharma. But the results are dramatic, and directionally consistent with the findings from the Deloitte study.
Why are startups better at R&D?
The data above certainly suggest that startups are more productive at R&D than big pharma. The analysis is far from definitive, but does support the conventional wisdom that startups are more “innovative”.
But why is that the case? Pharma has more resources than startups, access to more talent, better facilities, better libraries, and more internal expertise. They have the most experienced scientists and managers in the world.
I can only speculate as to why startups might be more productive at R&D. I haven't seen much research on the topic, and am not sure what data to collect in order to explore this further.
I hope that people continue to explore this topic. If startups are significantly better at R&D than big pharma, we should figure out why that is, and double down on whatever is helping us get more medicines out of our R&D dollars.
You may also like...
Top biotech VCs of 2018 and 2019
Valuing drugs and biotech companies
Venture returns from biopharma IPOs, 2018-Q1 2019
Valuations of biotech startups from Series A to IPO
Did you enjoy this article?
Then consider joining our mailing list. I periodically publish data-driven articles on the biotech startup and VC world.