Venture returns from recent biopharma IPOs
Richard Murphey, 4/10/2019
In a previous post, I examined the valuations of biopharma companies from Series A to IPO. In this post I'll look at the returns generated from investments in companies that went public from 2018-1Q2019.
CAVEAT
It is important to note that these are immature returns that are not reflective of the ultimate returns these companies will generate, and not an accurate estimate of the returns VCs will generate. This is simply an analysis of the estimated interim returns generated by venture investments in biopharma companies that went public from 2018-Q1 2019. Among other reasons, these returns don't represent ultimate returns from investments in companies, or returns to funds / Series overall, because:
- These investments represent only the subset of companies that went public in 2018-Q1 2019. These returns do not include companies that went public in prior years, exited via M&A, younger companies that may successfully return proceeds to investors at a later date, or failed investments.
- These returns in most cases come from the early stages of a fund’s life. Most of these IPOs happened ~3 years after Series A, and less than a year after Series C. VC funds are generally 10-year vehicles, so these investments still have several years to "mature".
- An IPO is often a financing event, not an exit: these companies can grow significantly after the IPO (Kite’s and AveXis’ share prices increased 11x post-IPO, Loxo’s grew 18x), and VCs often hold on to these investments for long periods after IPO. The IPO class of 2017 grew on average 42% from IPO to 4/1/2019 (median 9%), and 20% of them have seen their stock prices more than double since IPO. Of course, these public companies can decline in value as well.
- These IRRs do not include fees or expenses incurred by the VC.
While we cannot predict the ultimate returns to venture investors that these newly public companies will generate, and certainly cannot predict the returns to venture funds more broadly with this data, it is nevertheless interesting to examine the returns these companies have generated through IPO.
Cash-on-cash returns
I’ll start by looking at the cash-on-cash returns (price per share at IPO / split-adjusted price per preferred share in each round). The “# of investments” column represents investments where data was available and the company raised the round in question; I don’t have as much data for seed investments as I do for later-stage investments.
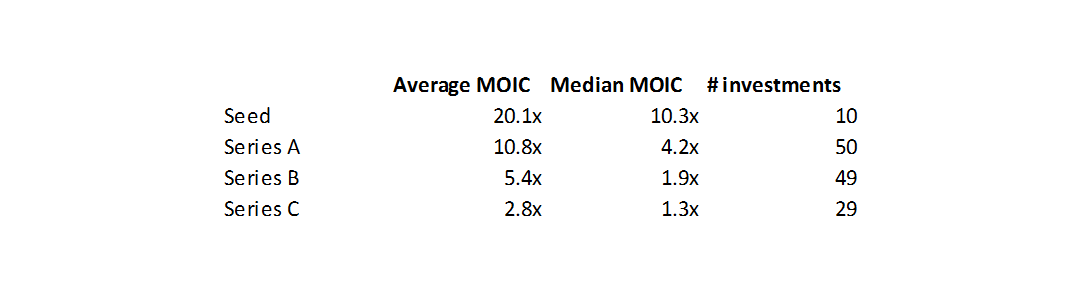
A few things to note: first, the average multiples are much higher than the medians. This makes sense as a very large share of total venture capital returns are generated by just a few very successful companies. Second, Series A MOICs are much higher than B or C: Series A investors benefit from larger valuation step-ups than their later-stage counterparts.
Cash-on-cash returns are often used to evaluate VC returns. VCs typically try to get a 3x or greater cash-on-cash return on their entire fund over the ~10 year life of the fund. However, as we are looking at a very young and immature “vintage” of venture investment, cash-on-cash returns at this point are not predictive of "final" returns.
We can get a sense for how close to maturity these investments might be by looking at time from investment to IPO.
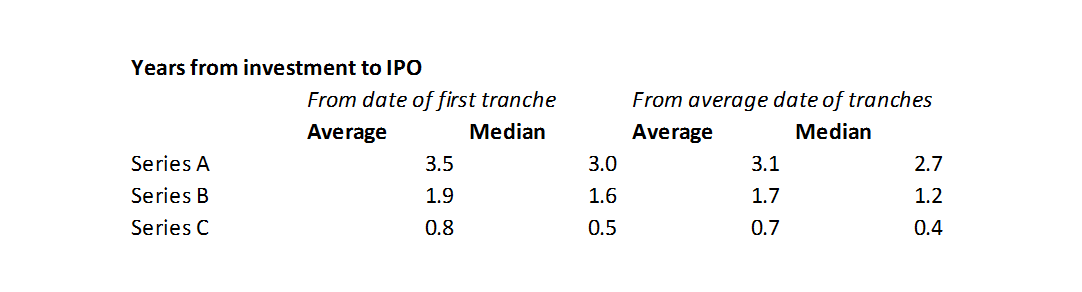
Companies are going public ~3 years from Series A investment, and just 6 months from Series C investment (Series C rounds are often led by “crossover” investors who are active public market investors). VCs typically have a 5-7+ year holding period for their investments, so can hold on to these investments for many years after the IPO.
Internal rate of return (IRRs)
We can incorporate time into our returns calculations by calculating internal rate of return (IRR).
We can calculate IRRs to venture investors using Excel’s XIRR formula, using as inputs the dates and amounts of venture investments in companies that went public by Series and dates and amounts of the investments’ public-market value. This yields the following IRRs:
- IRR of Series A investments in recent biopharma IPOs: 60.1%
- IRR of Series B investments in recent biopharma IPOs: 64.3%
- IRR of Series C investments in recent biopharma IPOs: 127.8%
Above, we showed that Series A investments have average and median cash-on-cash returns of 10.8x and 4.2x while Series C investments had average and median cash-on-cash returns of 2.8x and 1.3x. But we see that Series C IRR is more than double Series A IRR. This is because of the time component of returns. Companies that raise a Series C and then IPO typically go public less than a year after Series C. By comparison, companies go public roughly 3-4 years after Series A.
At first glance, it appears that Series C investments have been more lucrative than Series A or B investing. But as we mentioned earlier, we cannot draw conclusions about overall returns based on this data. One major reason why we cannot draw broader conclusions is that these returns do not include failed investments.
I don't have sufficient data to accurately estimate the aggregate "failed investments" of funds that invested in this IPO class, so can't accurately estimate interim returns for Series A / B / C investments in aggregate. However, we can examine the theoretical impact of failed investments on fund returns in order to better understand what sorts of strategies might work for different types of investors.
To model impact of failed investments on interim returns, we can observe how a range of “loss rates” impacts returns. For the sake of simplicity, I will define loss rate as “percentage of dollars invested that return $0” (rather than using dollar-weighted loss rates).
The above caveats hold here -- these are estimated interim returns, which are not good predictors of the ultimate returns these companies will generate. And as we are layering on assumptions about loss rates to these estimated interim returns, these IRRs are illustrative, not actual. If anything, these are illustrative of minimum potential returns to these venture Series, as they include failures, but don't include any M&A exits, and include only immature gains from IPOs. Of course, these newly public companies can decline in value as well, but historically the gains have outweighed the losses.
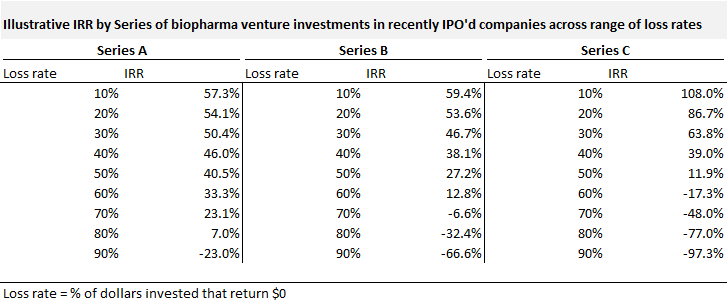
To calculate these IRRs, I started with the same data used to calculate the interim IRRs previously. I then modified the amount invested by adding a “loss multiplier” to each investment: for example, if $50M in Series A investments were made on January 5, 2016, and the loss multiplier was 2x, I changed the amount invested on January 5, 2016 from $50M to $100M. The loss multiplier = 1 / (1 – loss rate).
We see that Series A IRRs are much more robust to loss rates than are Series B or C returns. This is not surprising, although it is helpful to see the sensitivity to loss rates quantitatively.
To get a 25% IRR in this case, a Series A fund can lose ~70% of every dollar invested, a Series B fund can lose ~50% of every dollar invested, and a Series C fund can lose ~45% of every dollar invested.
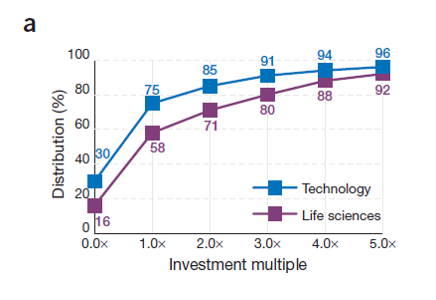
What loss rates do funds actually experience? This analysis from Nature Biotech (from 2011, so a bit dated at this point) by Bruce Booth and Bijan Salehizadeh suggests that 16% of biotech startups return $0 and 58% of biotech startups return less than the amount invested. A range for loss rates (as we define them) of 15-60% seems reasonable across all investment Series (presumably loss rates for Series A would be higher than Series C).
Are the "physics" of biotech VC becoming more like tech VC?
The above illustrative IRRs show that loss rate is important, but – depending on fund stage and strategy – growth and valuation at venture investment (which impact cash-on-cash-returns) are more important.
Low loss rates are important for later-stage funds that invest at higher valuations. At a given exit valuation, making initial investments at higher valuation constrains returns. Investing in challenging exit environments also constrains cash-on-cash returns and requires low loss rates. From ~2000-2012, the exit environment for biotech startups was challenging: companies rarely exited for more than $500M or so. To get a venture return (returning 3x on a whole fund in ~10 years) in that environment, you needed low valuations and low loss rates.
But it seems that the "physics" of biotech VC are changing. Companies are growing bigger, faster than they have in 30 years. This enables a different kind of VC strategy to succeed -- a strategy that looks similar to the strategy used by many tech VCs.
Flagship's returns from 2018 IPOs are a good illustration of this. In 2018, three Flagship portfolio companies went public (Moderna, Rubius and Evelo). Flagship’s combined stake in these companies at IPO was worth $2.5B. Flagship probably invested in these companies out of its $269M second fund and $537M third fund.
Flagship’s 2018 IPOs alone returned 3x its second and third funds combined. If Flagship lost all of its money on every other investment across both its second and third funds (which it most certainly did not – 17 of its investments have gone public, including multi-billion-dollar companies like Agios and Receptos), it would still have generated solid returns across both funds.
The phenomenon where a very small number of investments generate the majority of returns – the “home run” strategy / “power law” phenomenon – is gospel among tech VCs, but it hasn’t applied to biotech – until, apparently, recently. In the last few decades, large exits like Moderna, Kite and Rubius were quite uncommon in biotech, and VCs could not assume they’d invest in many (if any) “unicorns”. In such a world, low loss rates are essential. But in a world where big exits are possible, finding big exits – and owning as much of them as possible – can be more important than minimizing loss rates.
Of course, you should take both high growth and low loss rates if you can – and that’s exactly what many early-stage biotech VCs have done in the last few years (plus low valuations to boot!). If the exit environment remains favorable, we can expect this to continue.