Biotech venture investor database

See how funds are faring during market turmoil with deal-level cash-on-cash returns, exit proceeds, check sizes, and performance metrics for 1,500+ biopharma investors covering $80B+ in global venture investment since January 2018.
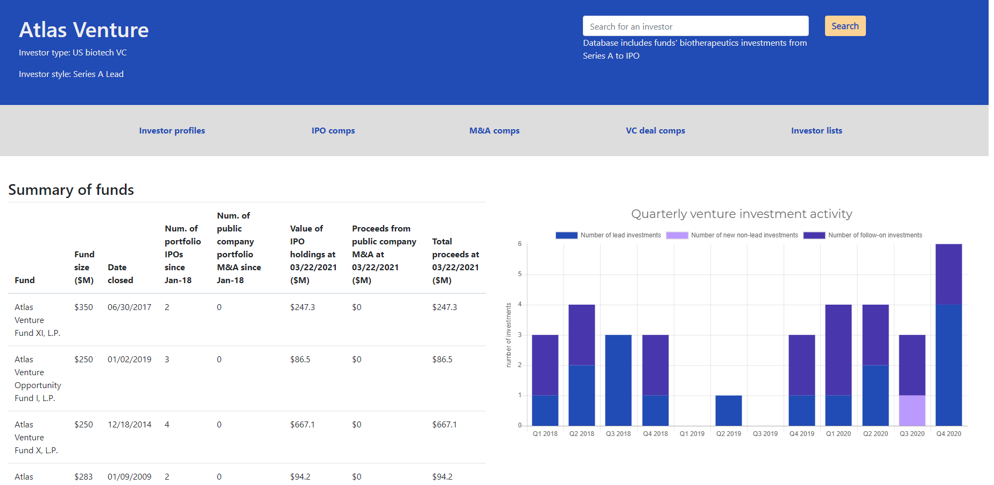
See which investments drive returns

Analyze portfolio concentration and returns distribution. Which funds returned the fund with a single investment? Which funds hit consistent triples and doubles?

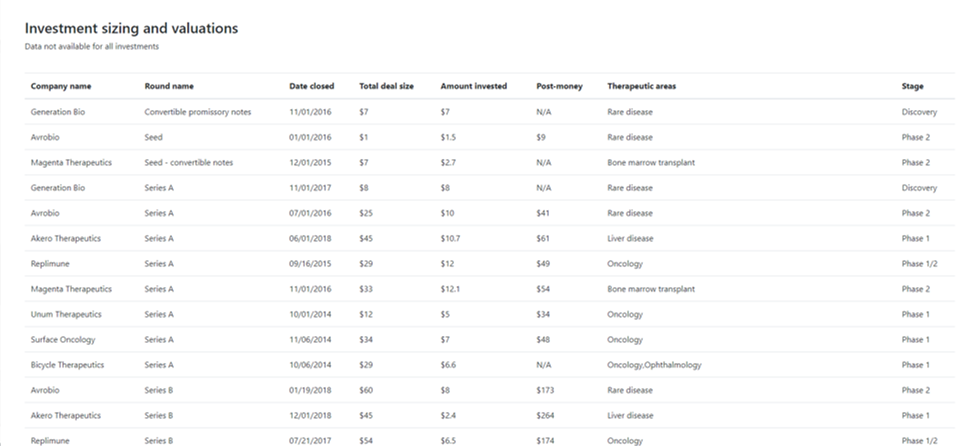
Entry valuations and check sizes

Analyze fund strategy and competitiveness with valuations and check size data for hundreds of rounds.

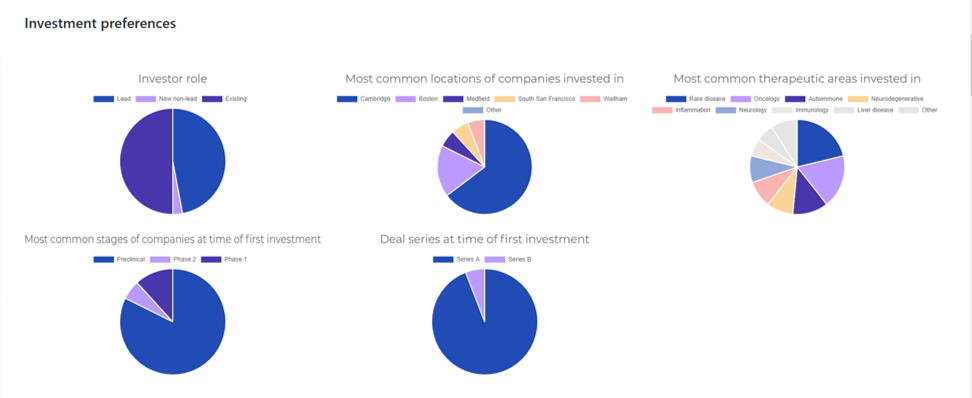
Fund investment preferences

Breakdown fund portfolios by therapeutic area, development stage, location, and deal series.

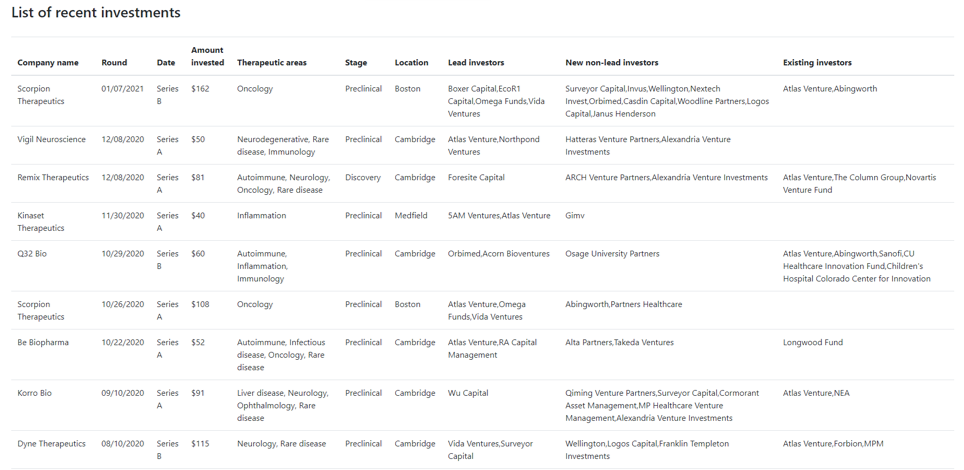
View recent investment activity

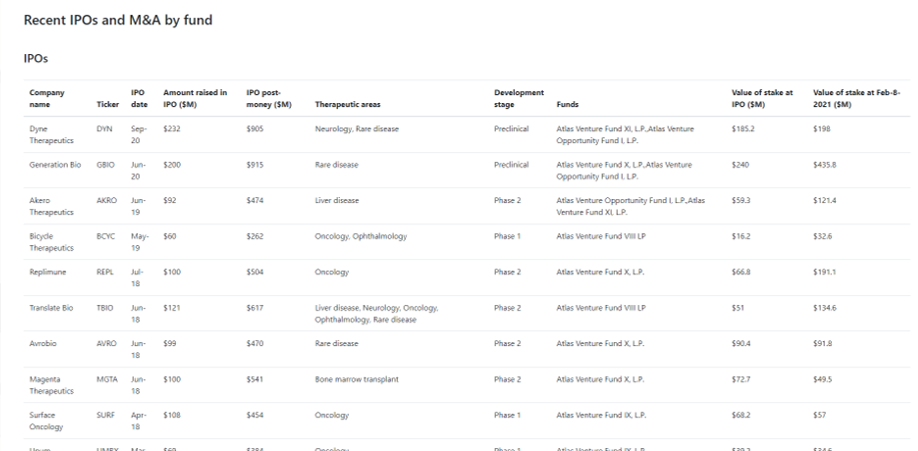
Details on investment activity since January 2018, including therapeutic area, stage and co-investors.

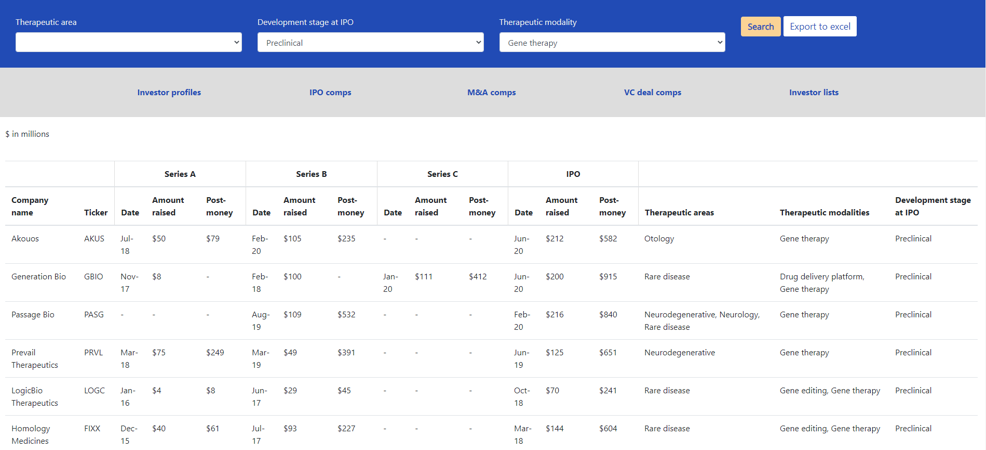
Deal comps

Biopharma-focused M&A, IPO and venture comps covering $55B+ in venture investment and hundreds of exits going back to January 2018.

  • IPO comps sortable by therapeutic modality, therapeutic area and development stage. Data includes valuations of private rounds through IPO.
  • M&A comps sortable by therapeutic area and development stage.
  • Recent startup funding sortable by therapeutic area, deal series and development stage.

View pricing options


Privacy policy

Terms of use

© 2021 Bay Bridge Bio, LLC