Will biotech IPOs come back in 2024?
The biotech IPO market collapsed as the Fed raised rates. With the Fed's tightening campaign at an apparent end, will biotech IPOs make a comeback?
Key takeaways:
- After the Fed's aggressive response to COVID in March 2020, the biotech IPO market surged.
- The IPO market collapsed after the Fed raised rates to tame inflation.
- In late 2023, the Fed signaled it was done raising rates; biotech stocks surged in response (further buoyed by an increase in M&A).
- It will take time for the IPO market to reopen, and for the near-term will primarily be open to quality clinical-stage companies.
Summary statistics
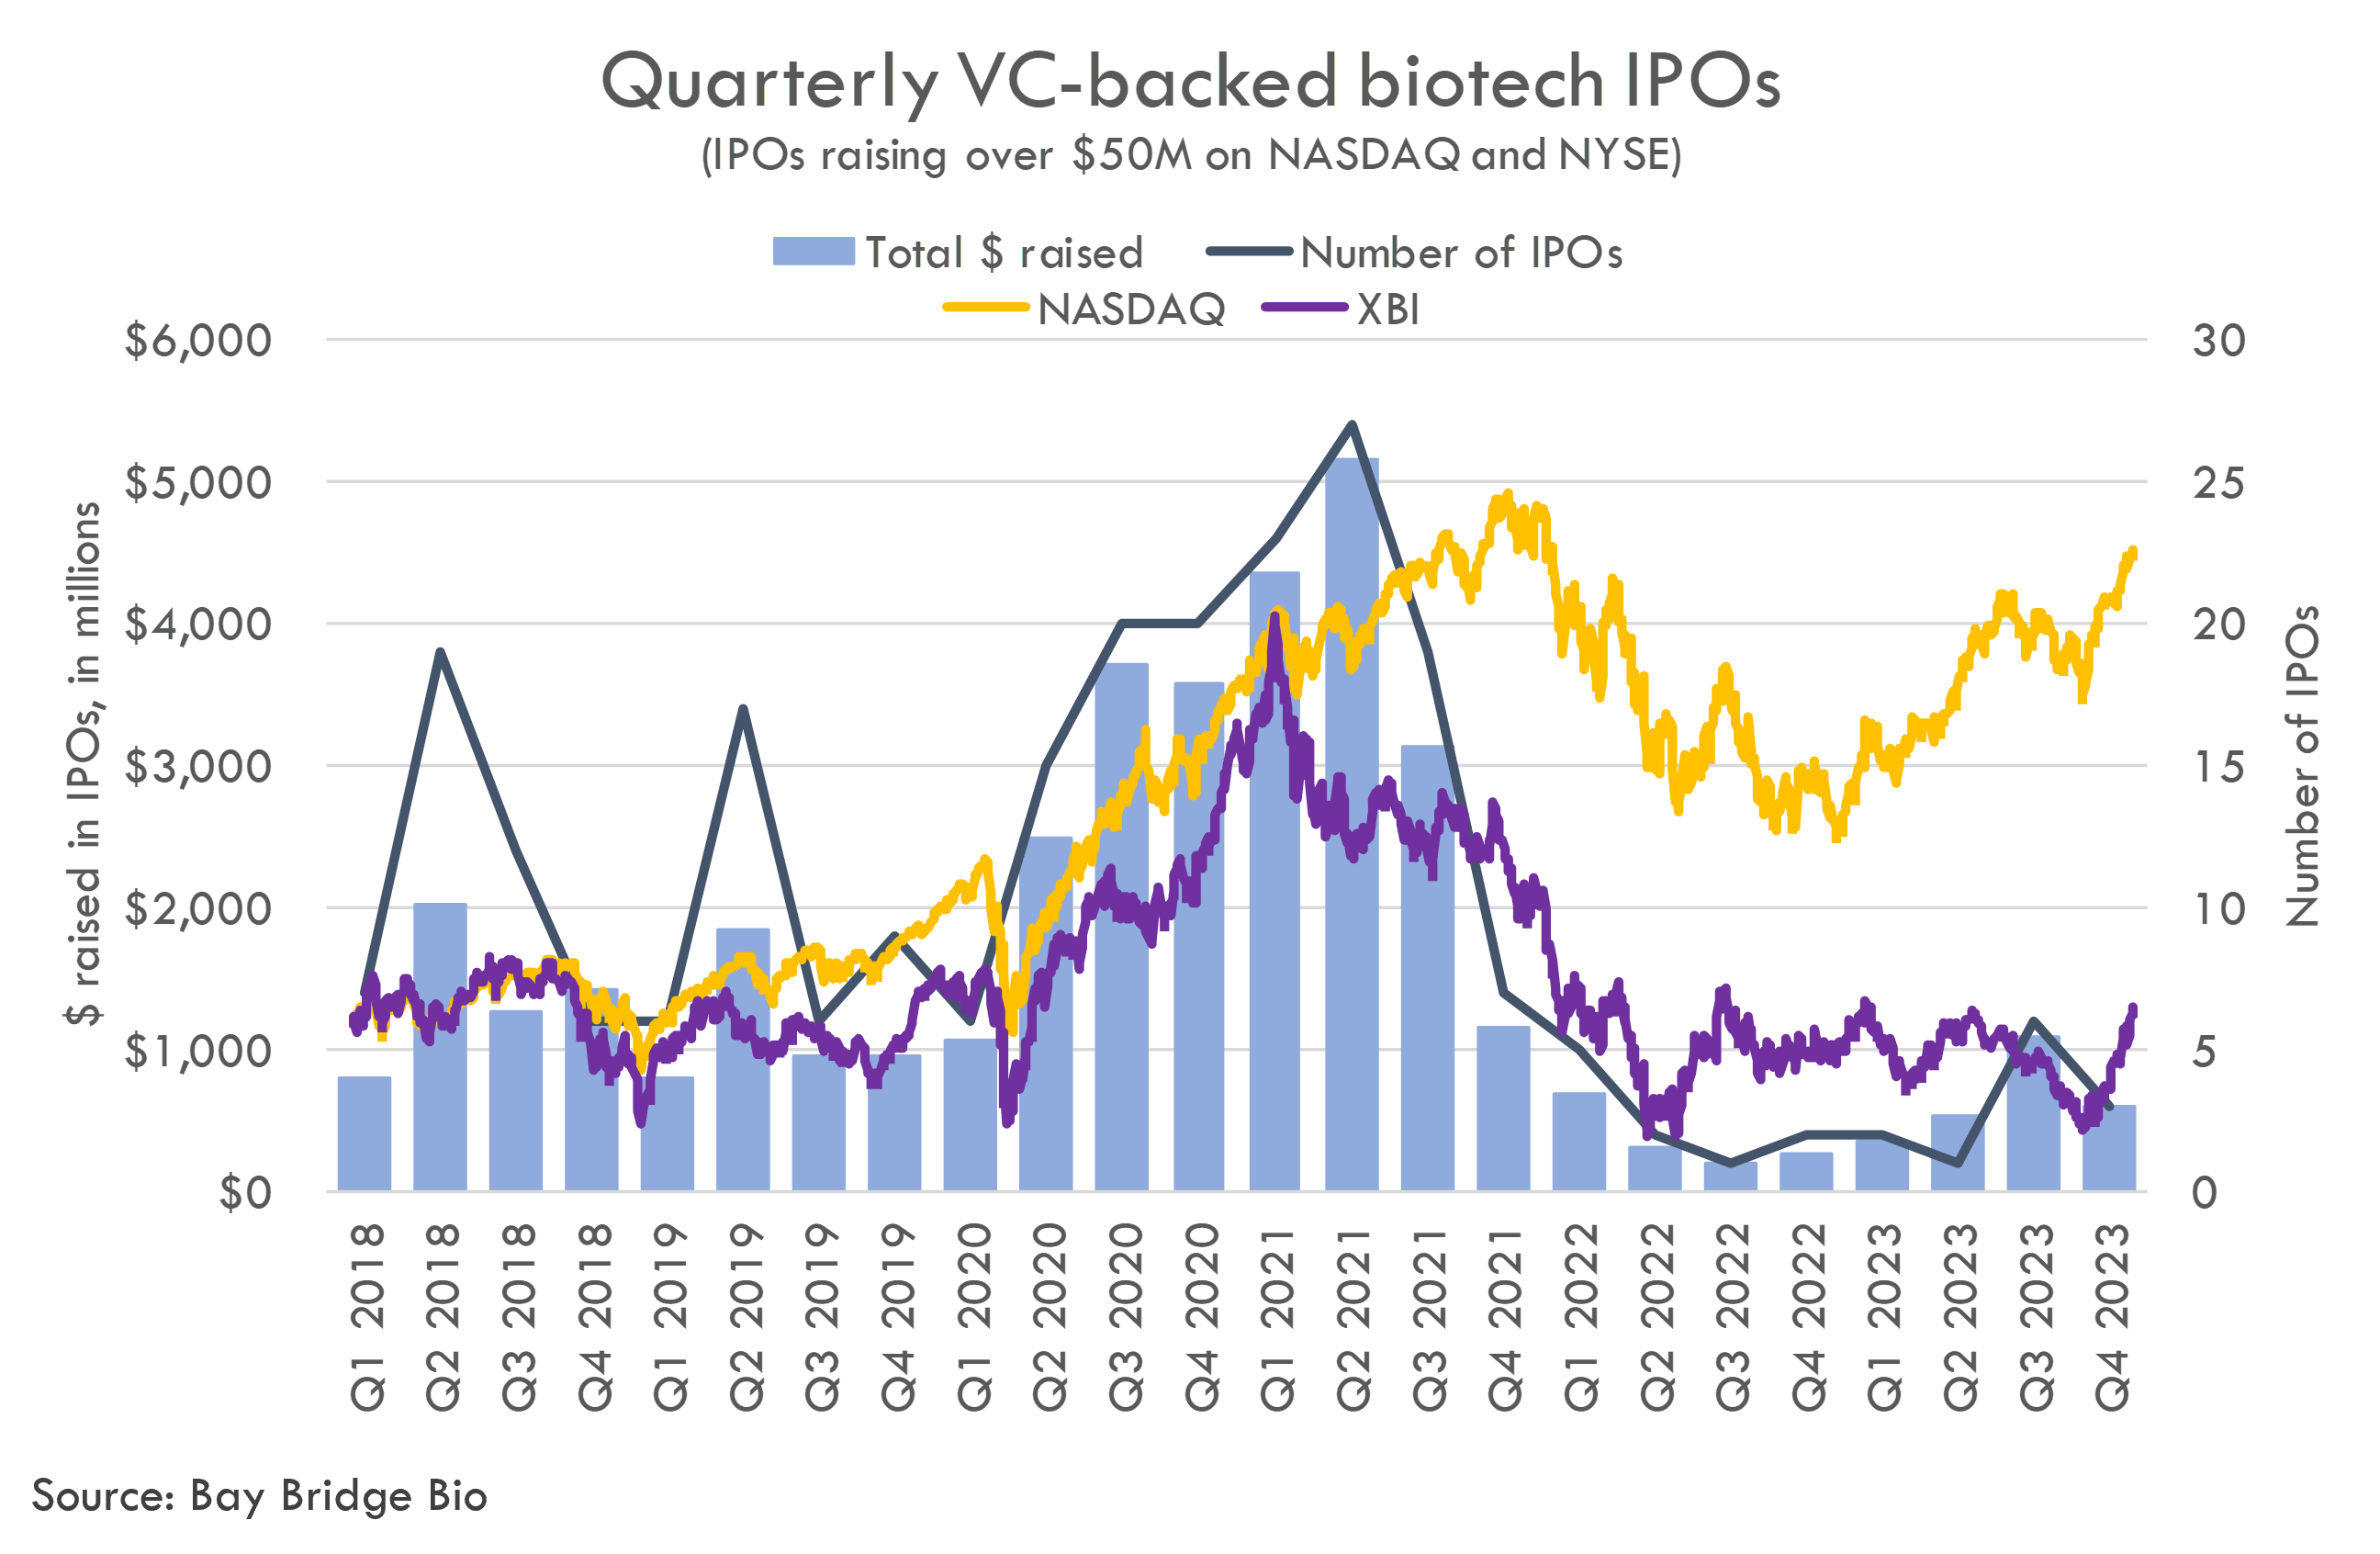
The biotech IPO market collapsed after the Fed's rate hike campaign. In 2022 and 2023, there were only 22 major VC-backed IPOs on US exchanges.
The public biotech market rebounded in late 2023 in anticipation of the Fed pivot and an uptick in M&A, though it remains suppressed relative to 2020-2021 levels.
The S&P 500 and NASDAQ are back at record or near-record levels, so investors looking for more yield will eventually turn to riskier stocks like biotech. Currently, the most in-favor biotech stocks are on M&A candidates (companies with differentiated, derisked clinical stage assets). If the rally continues, eventually more speculative assets will appreciate as investors search for yield (though it could take significant time for this to occur).
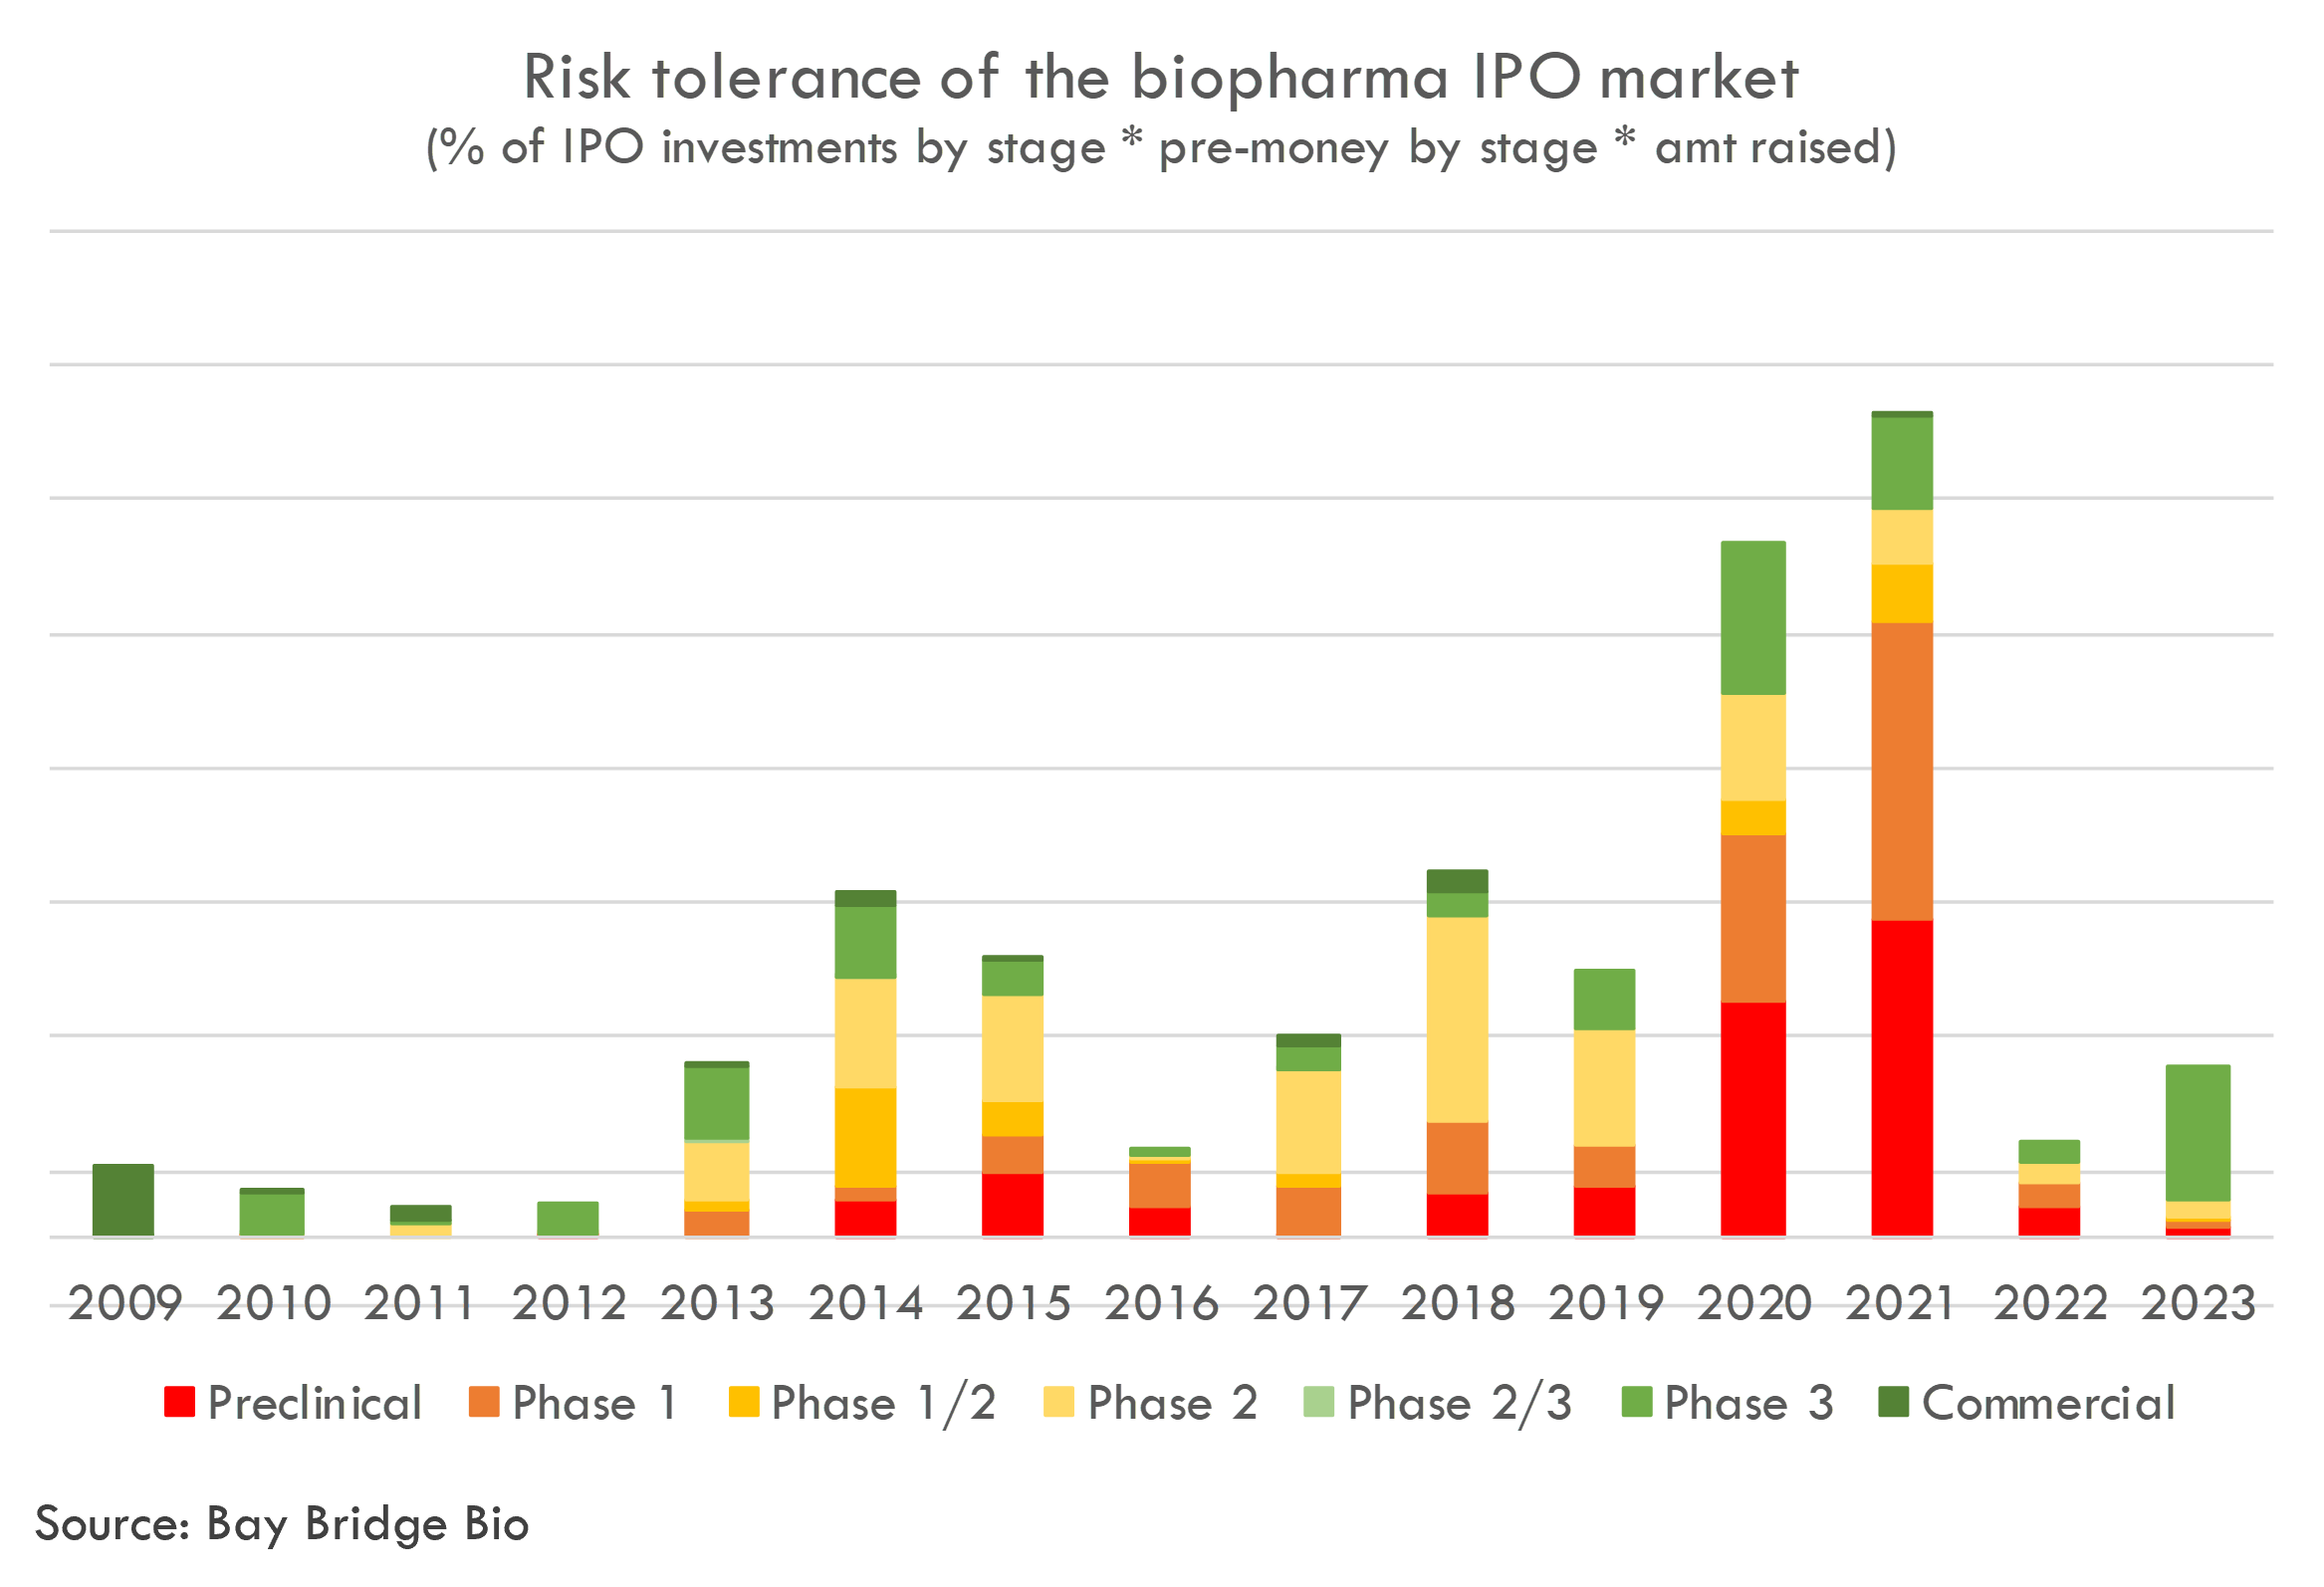
The risk tolerance of the biopharma IPO market (which we measure using a combination of amount invested in IPOs, development stage of IPOs and IPO valuations) crashed in 2022.
IPO investors increased their risk tolerance in 2023, although they primarily did this by investing a lot of money into assets with perceived high quality (Phase 3 assets in strategic indications with quality mid-stage clinical data, like SLRN, NMRA and RYZB) at high valuations.
Another takeaway from the chart is how quickly risk tolerance can change. If markets stay positive, 2024 could be another 2014 or 2018. These were the two biggest years for biotech IPOs apart from the COVID bubble. In this case, the IPO market in the beginning of the year would mostly be open to mid-late stage clinical assets and then would open up to early-stage clinical names (and a handful of preclinical / platform companies).
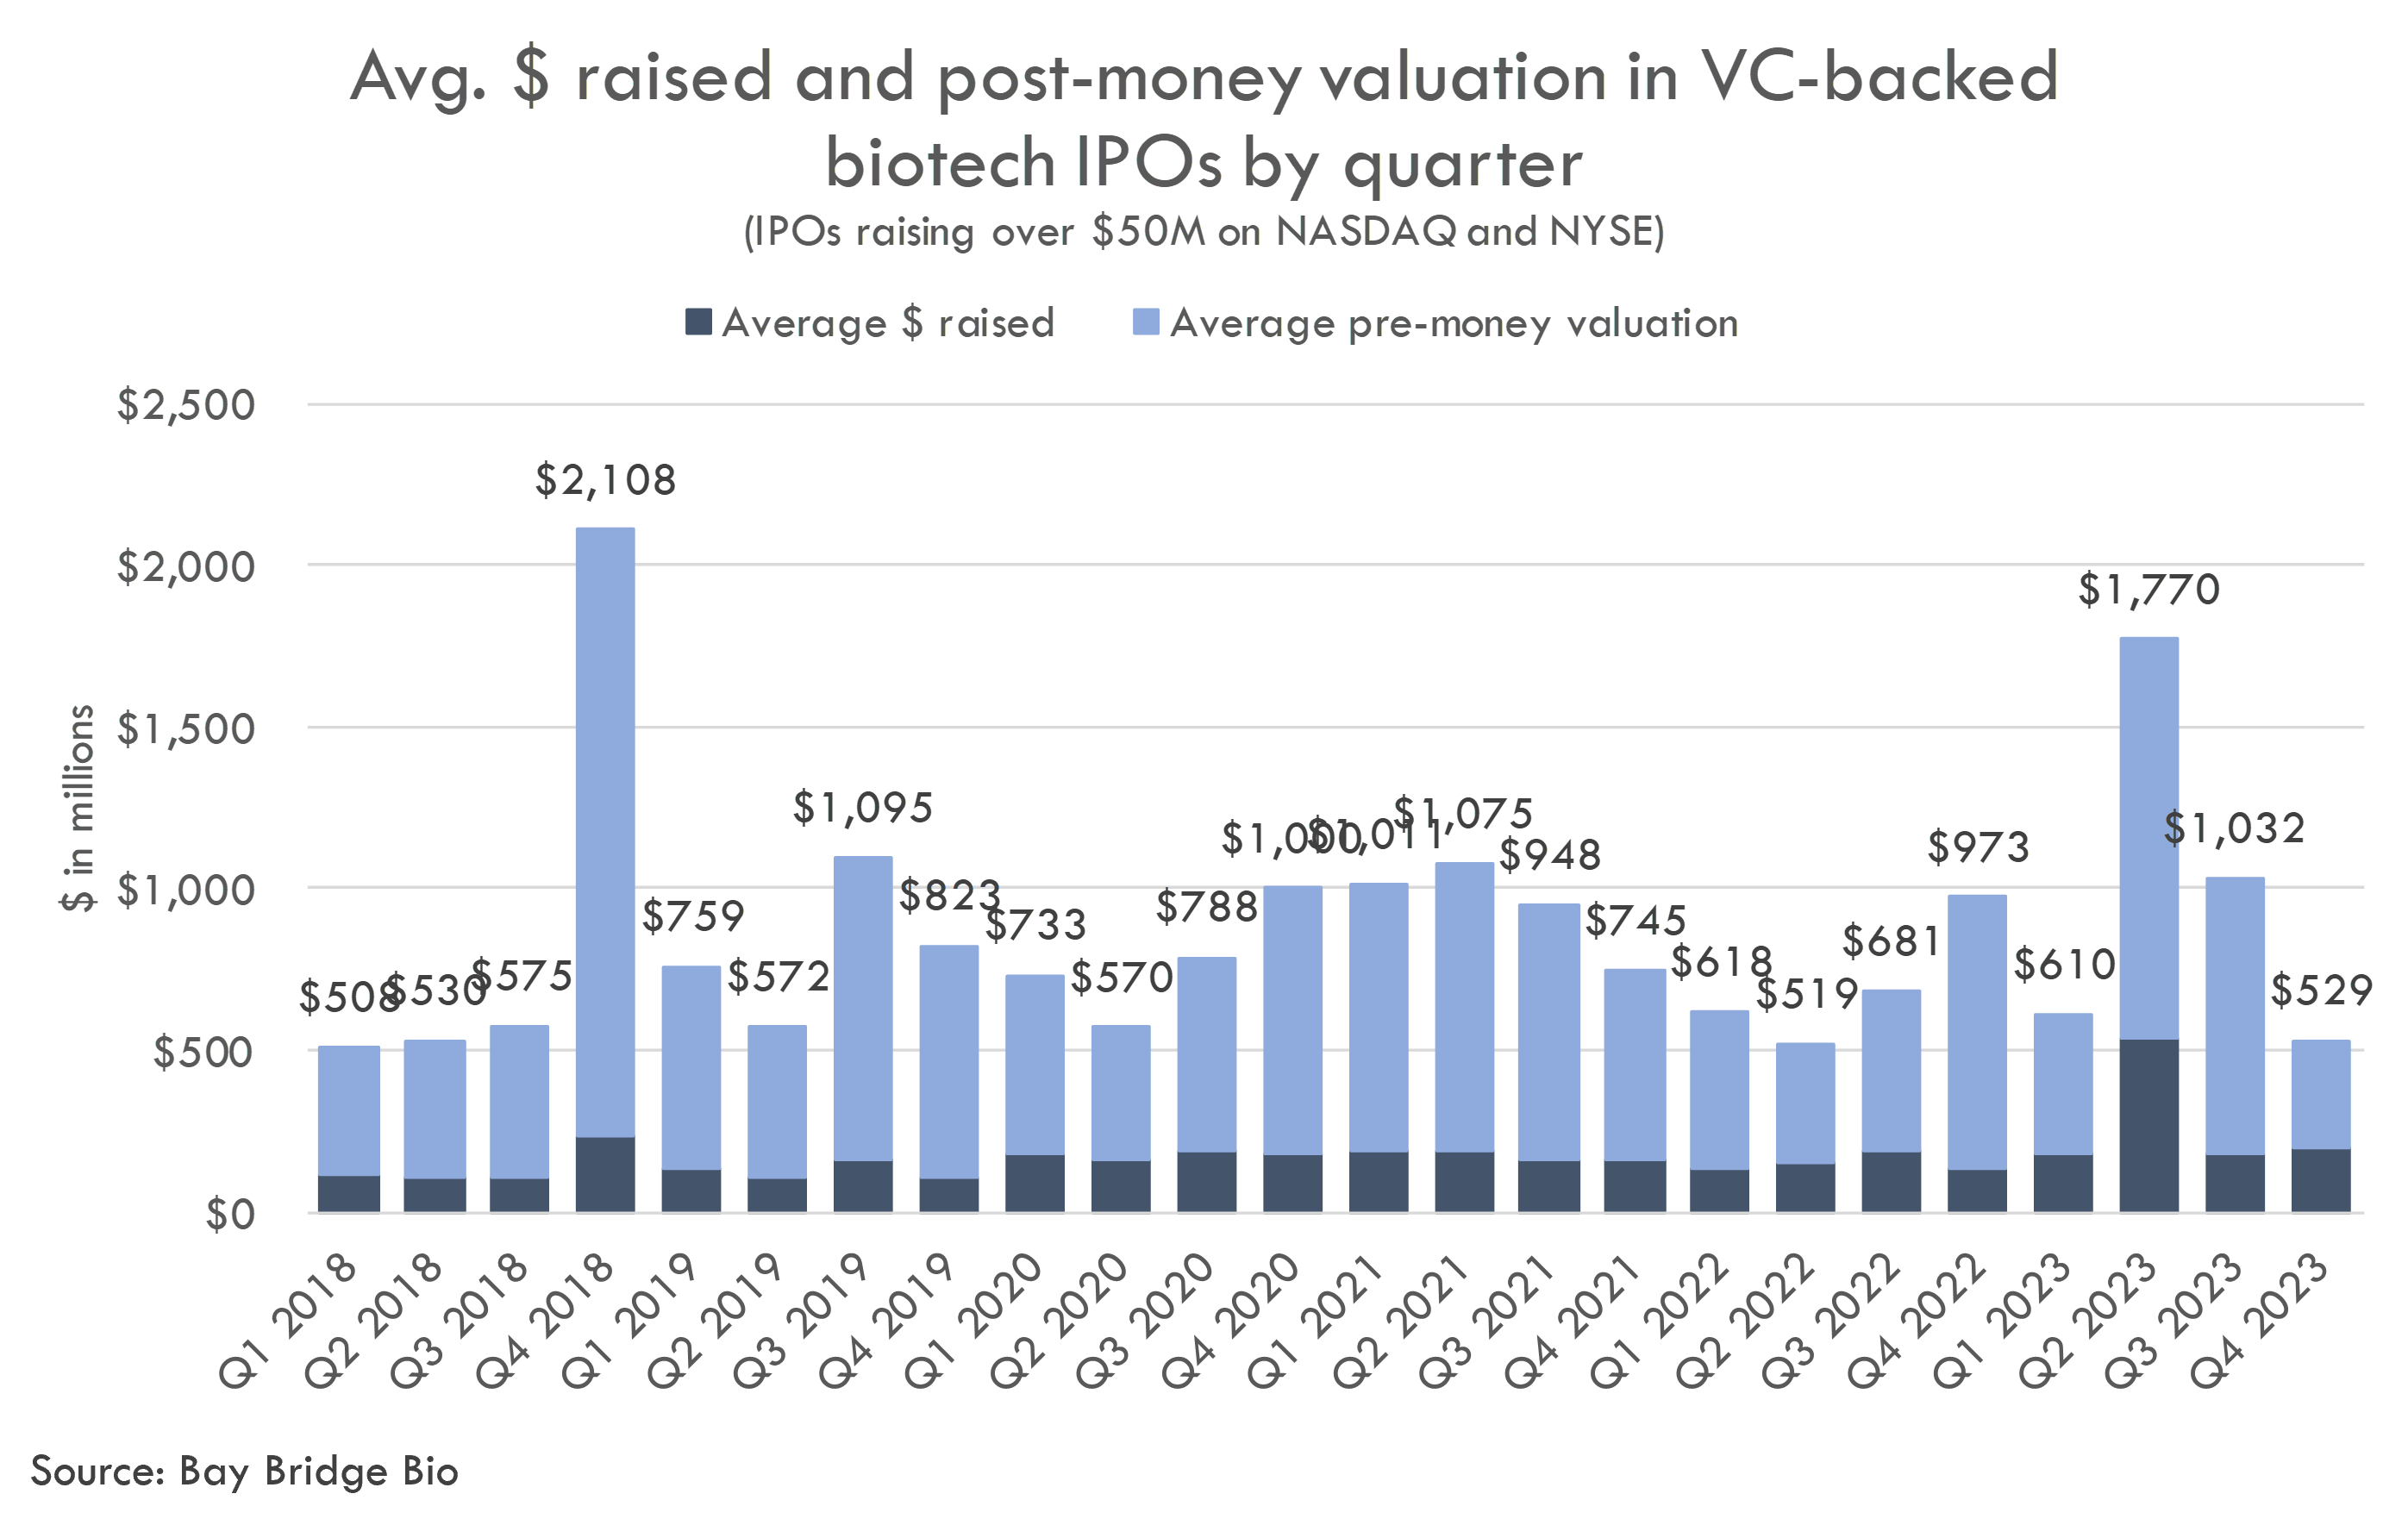
While the volume of IPOs has crashed, IPO valuations have generally stayed comparable to the 2020-2021 period.
The market continues to increasingly become one of haves and have-nots. The IPO market is still willing to invest a lot at high valuations into the perceived best-of-the-best, but little capital is available for other companies.
This is driven by the M&A market, where big pharma has demonstrated that it will pay large premiums to acquire strategic assets, but is quite selective and valuation-sensitive otherwise.
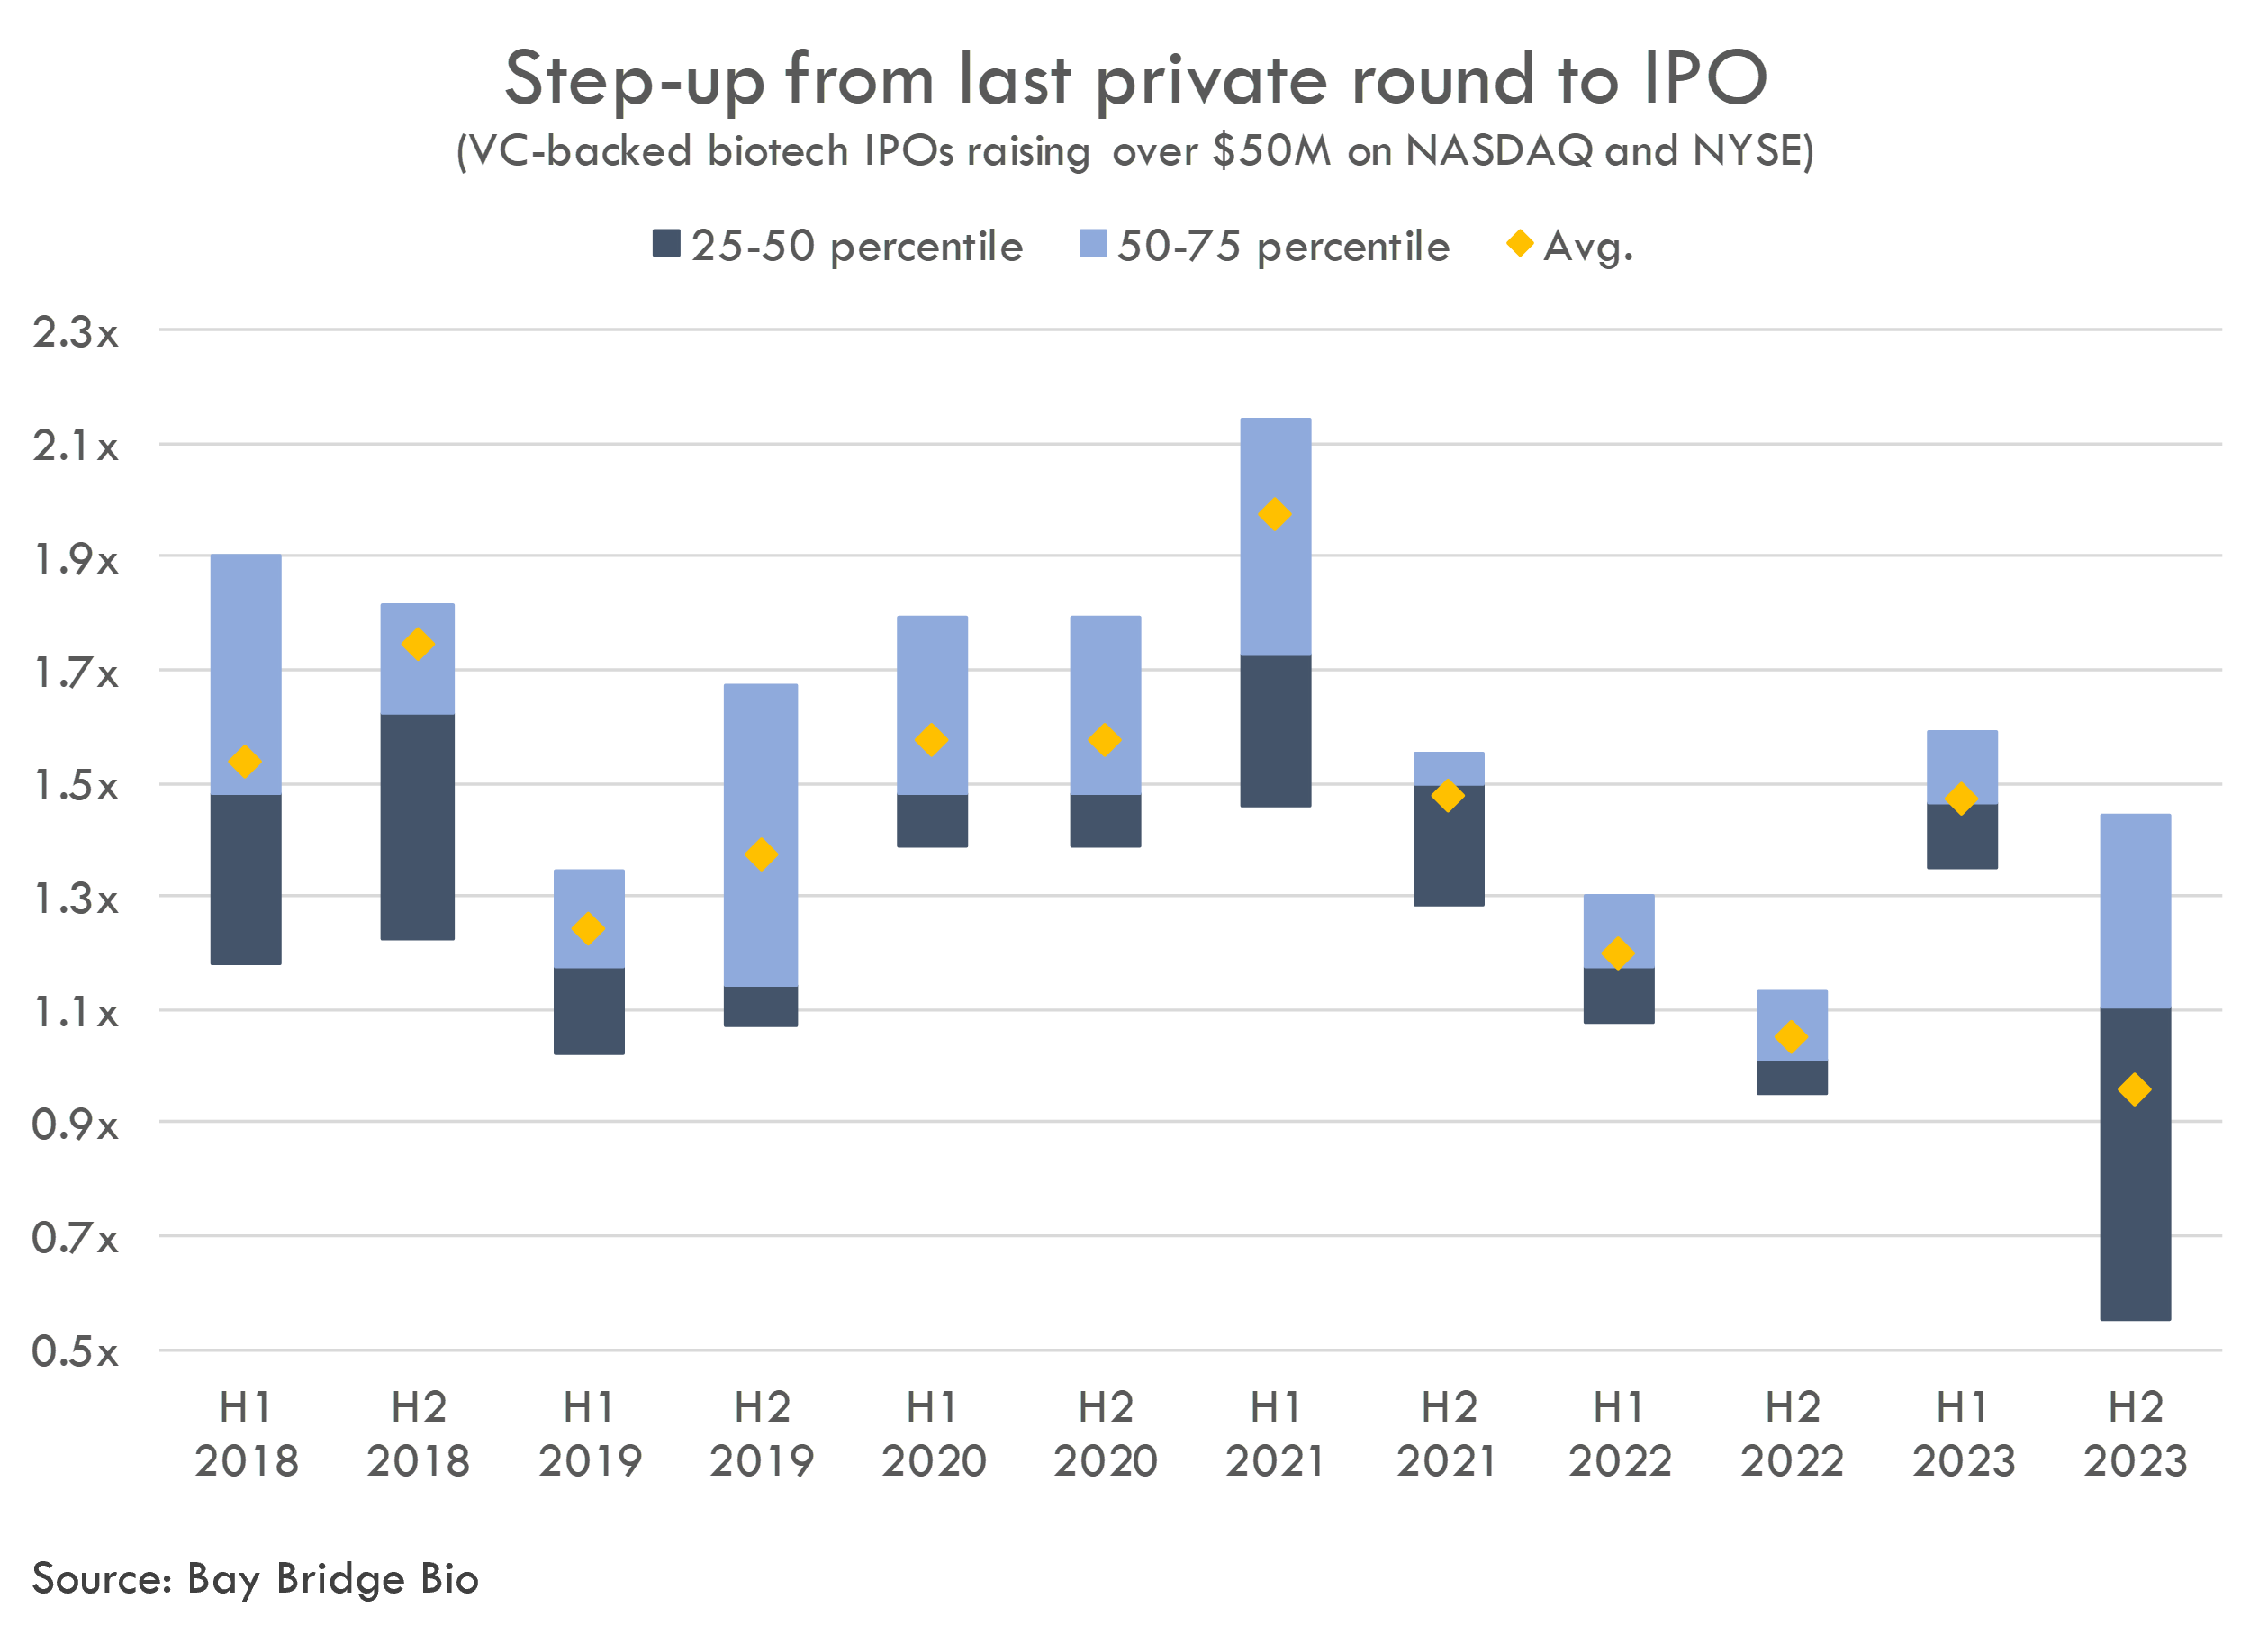
IPO prices are generally a 1.5-2.5x step-up to the last private round. Step-ups decreased as the biotech markets declined in 2021-2022.
Many private companies held off on raising priced rounds after the market crashed, in order to avoid down-rounds. Instead, they managed cash flow to make enough progress to go public and skipped the crossover round. Despite this, many priced their IPOs at a flat price or modest step-up to the last private round.
For startups whose last round was during the COVID heyday, it will be difficult to justify a large IPO step-up unless the company has made significant progress or is in a hot area.
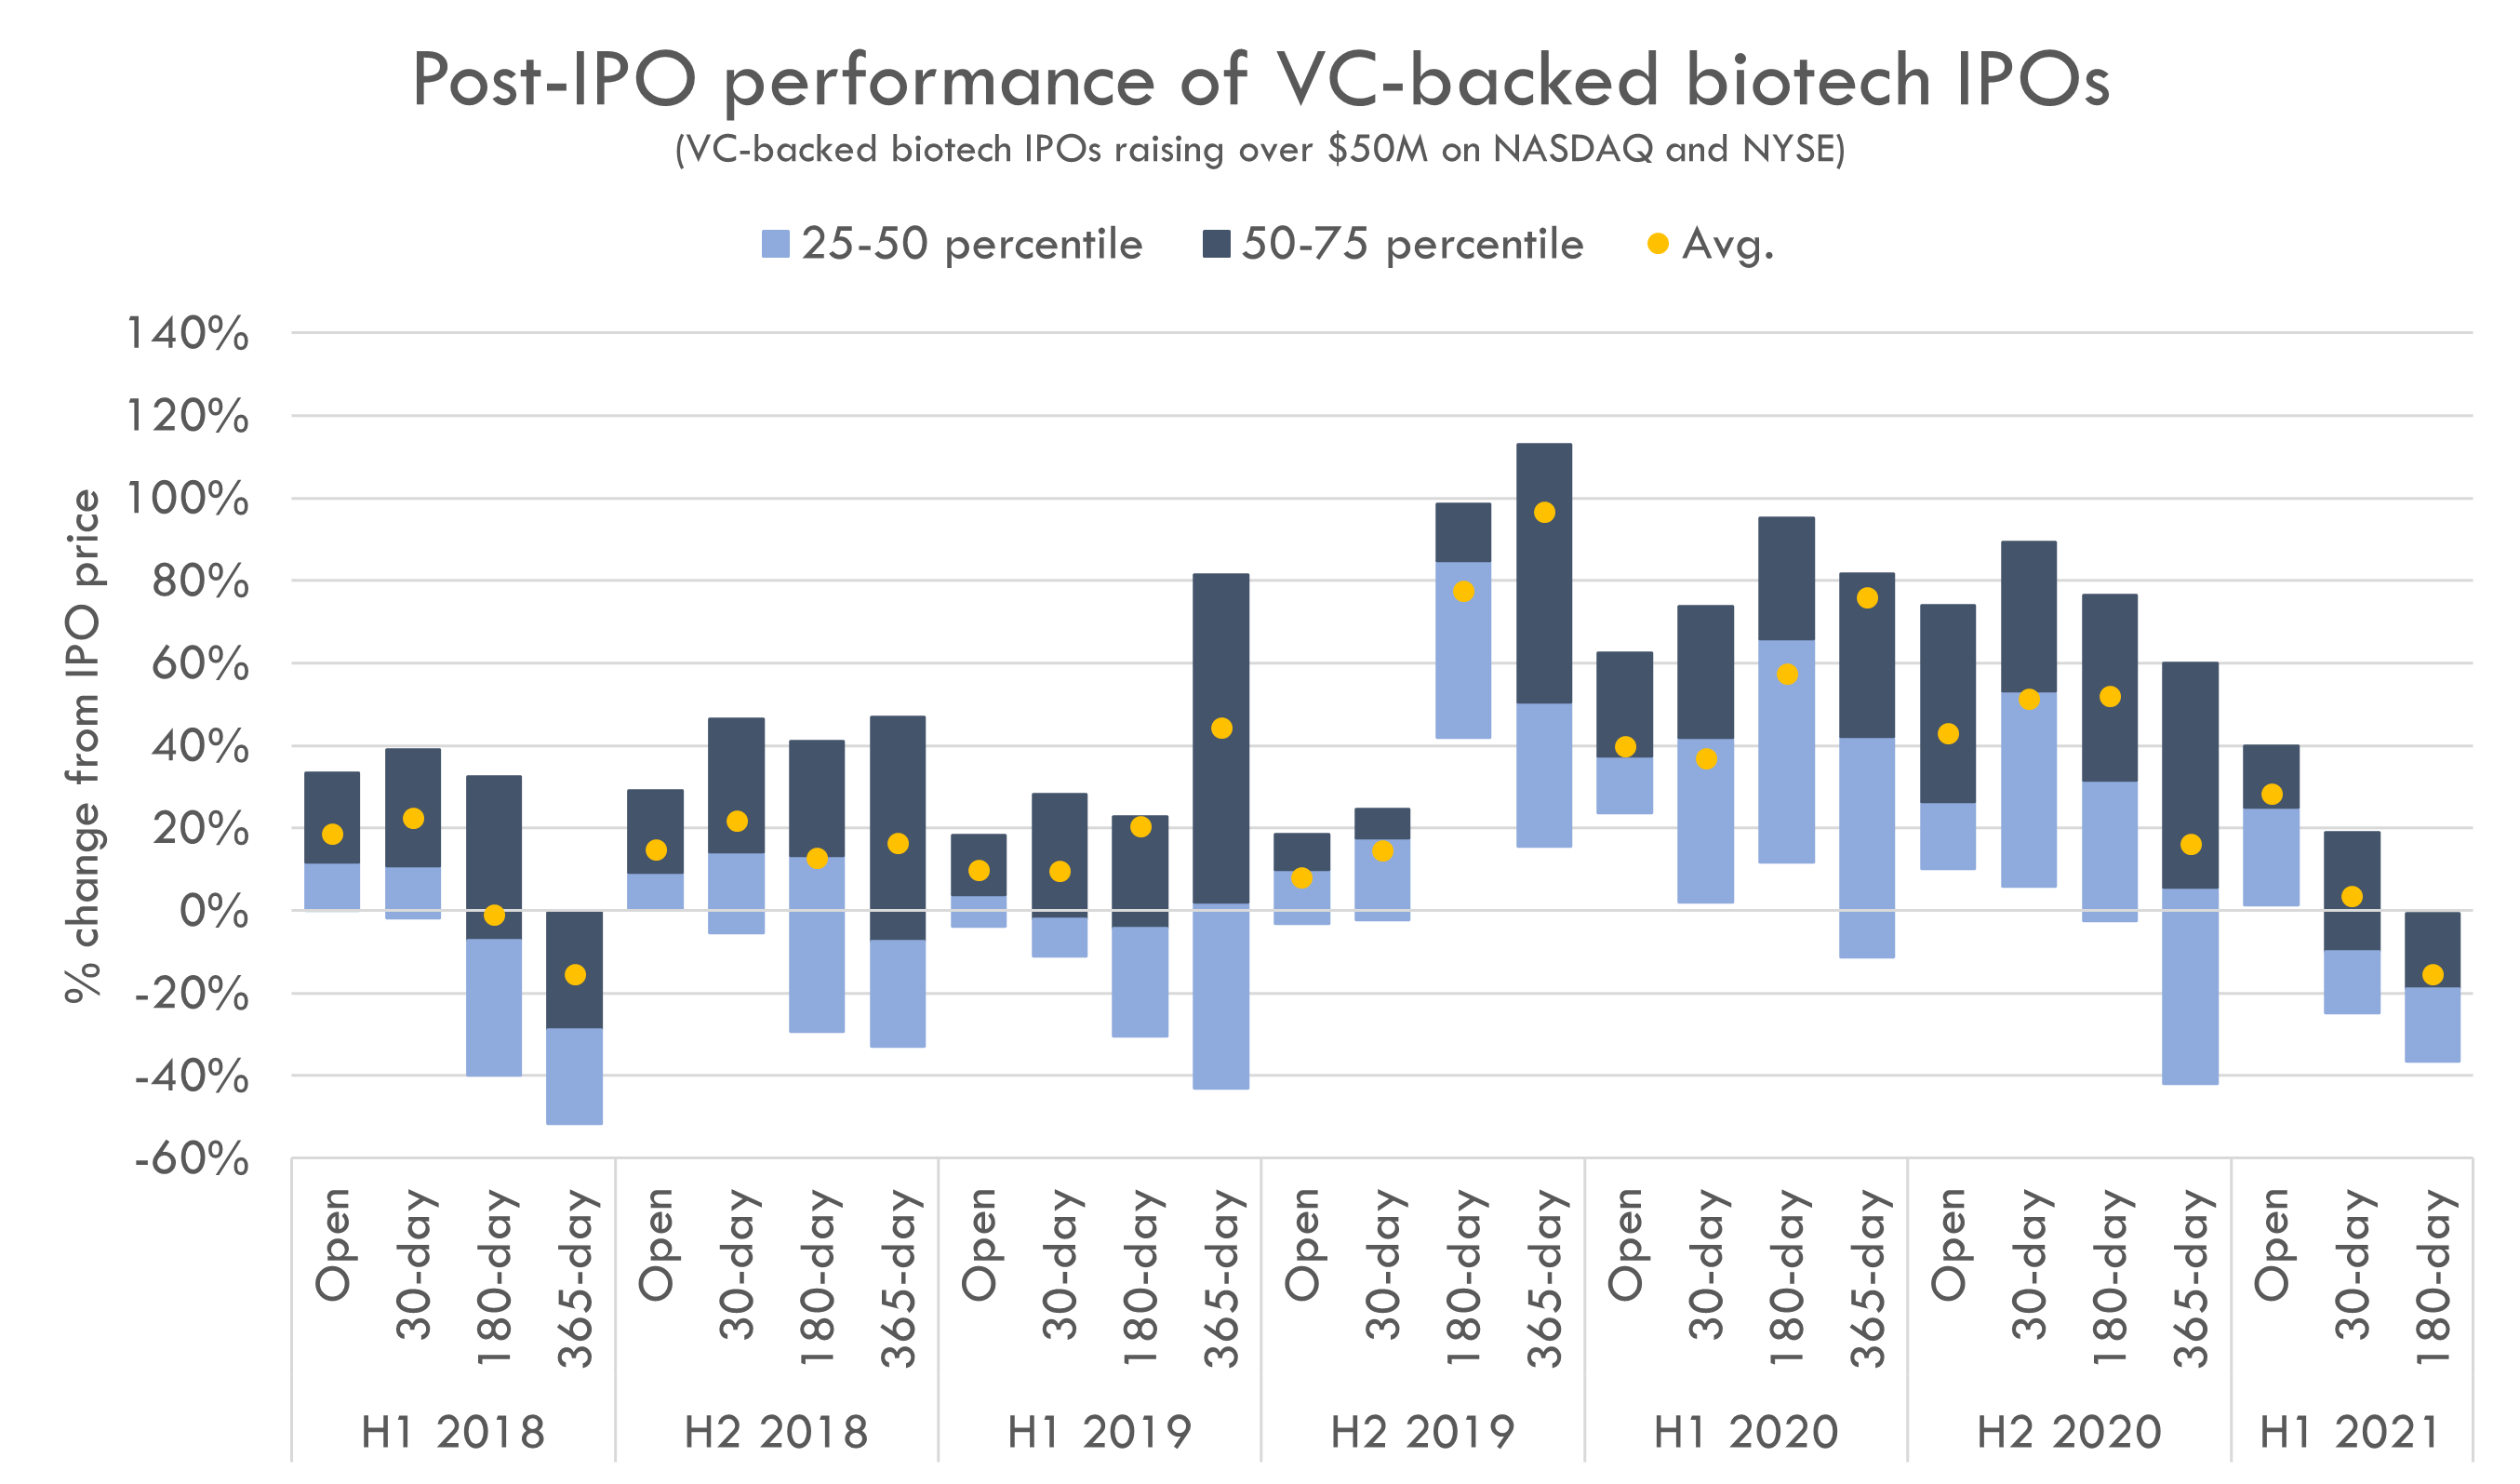
During the IPO boom, IPOs generally open around 20% higher than the IPO price.
2022 and 2023 IPOs have generally held their price through day 30 post-IPO, but most did not see an IPO pop, and most IPOs performed worse over time.
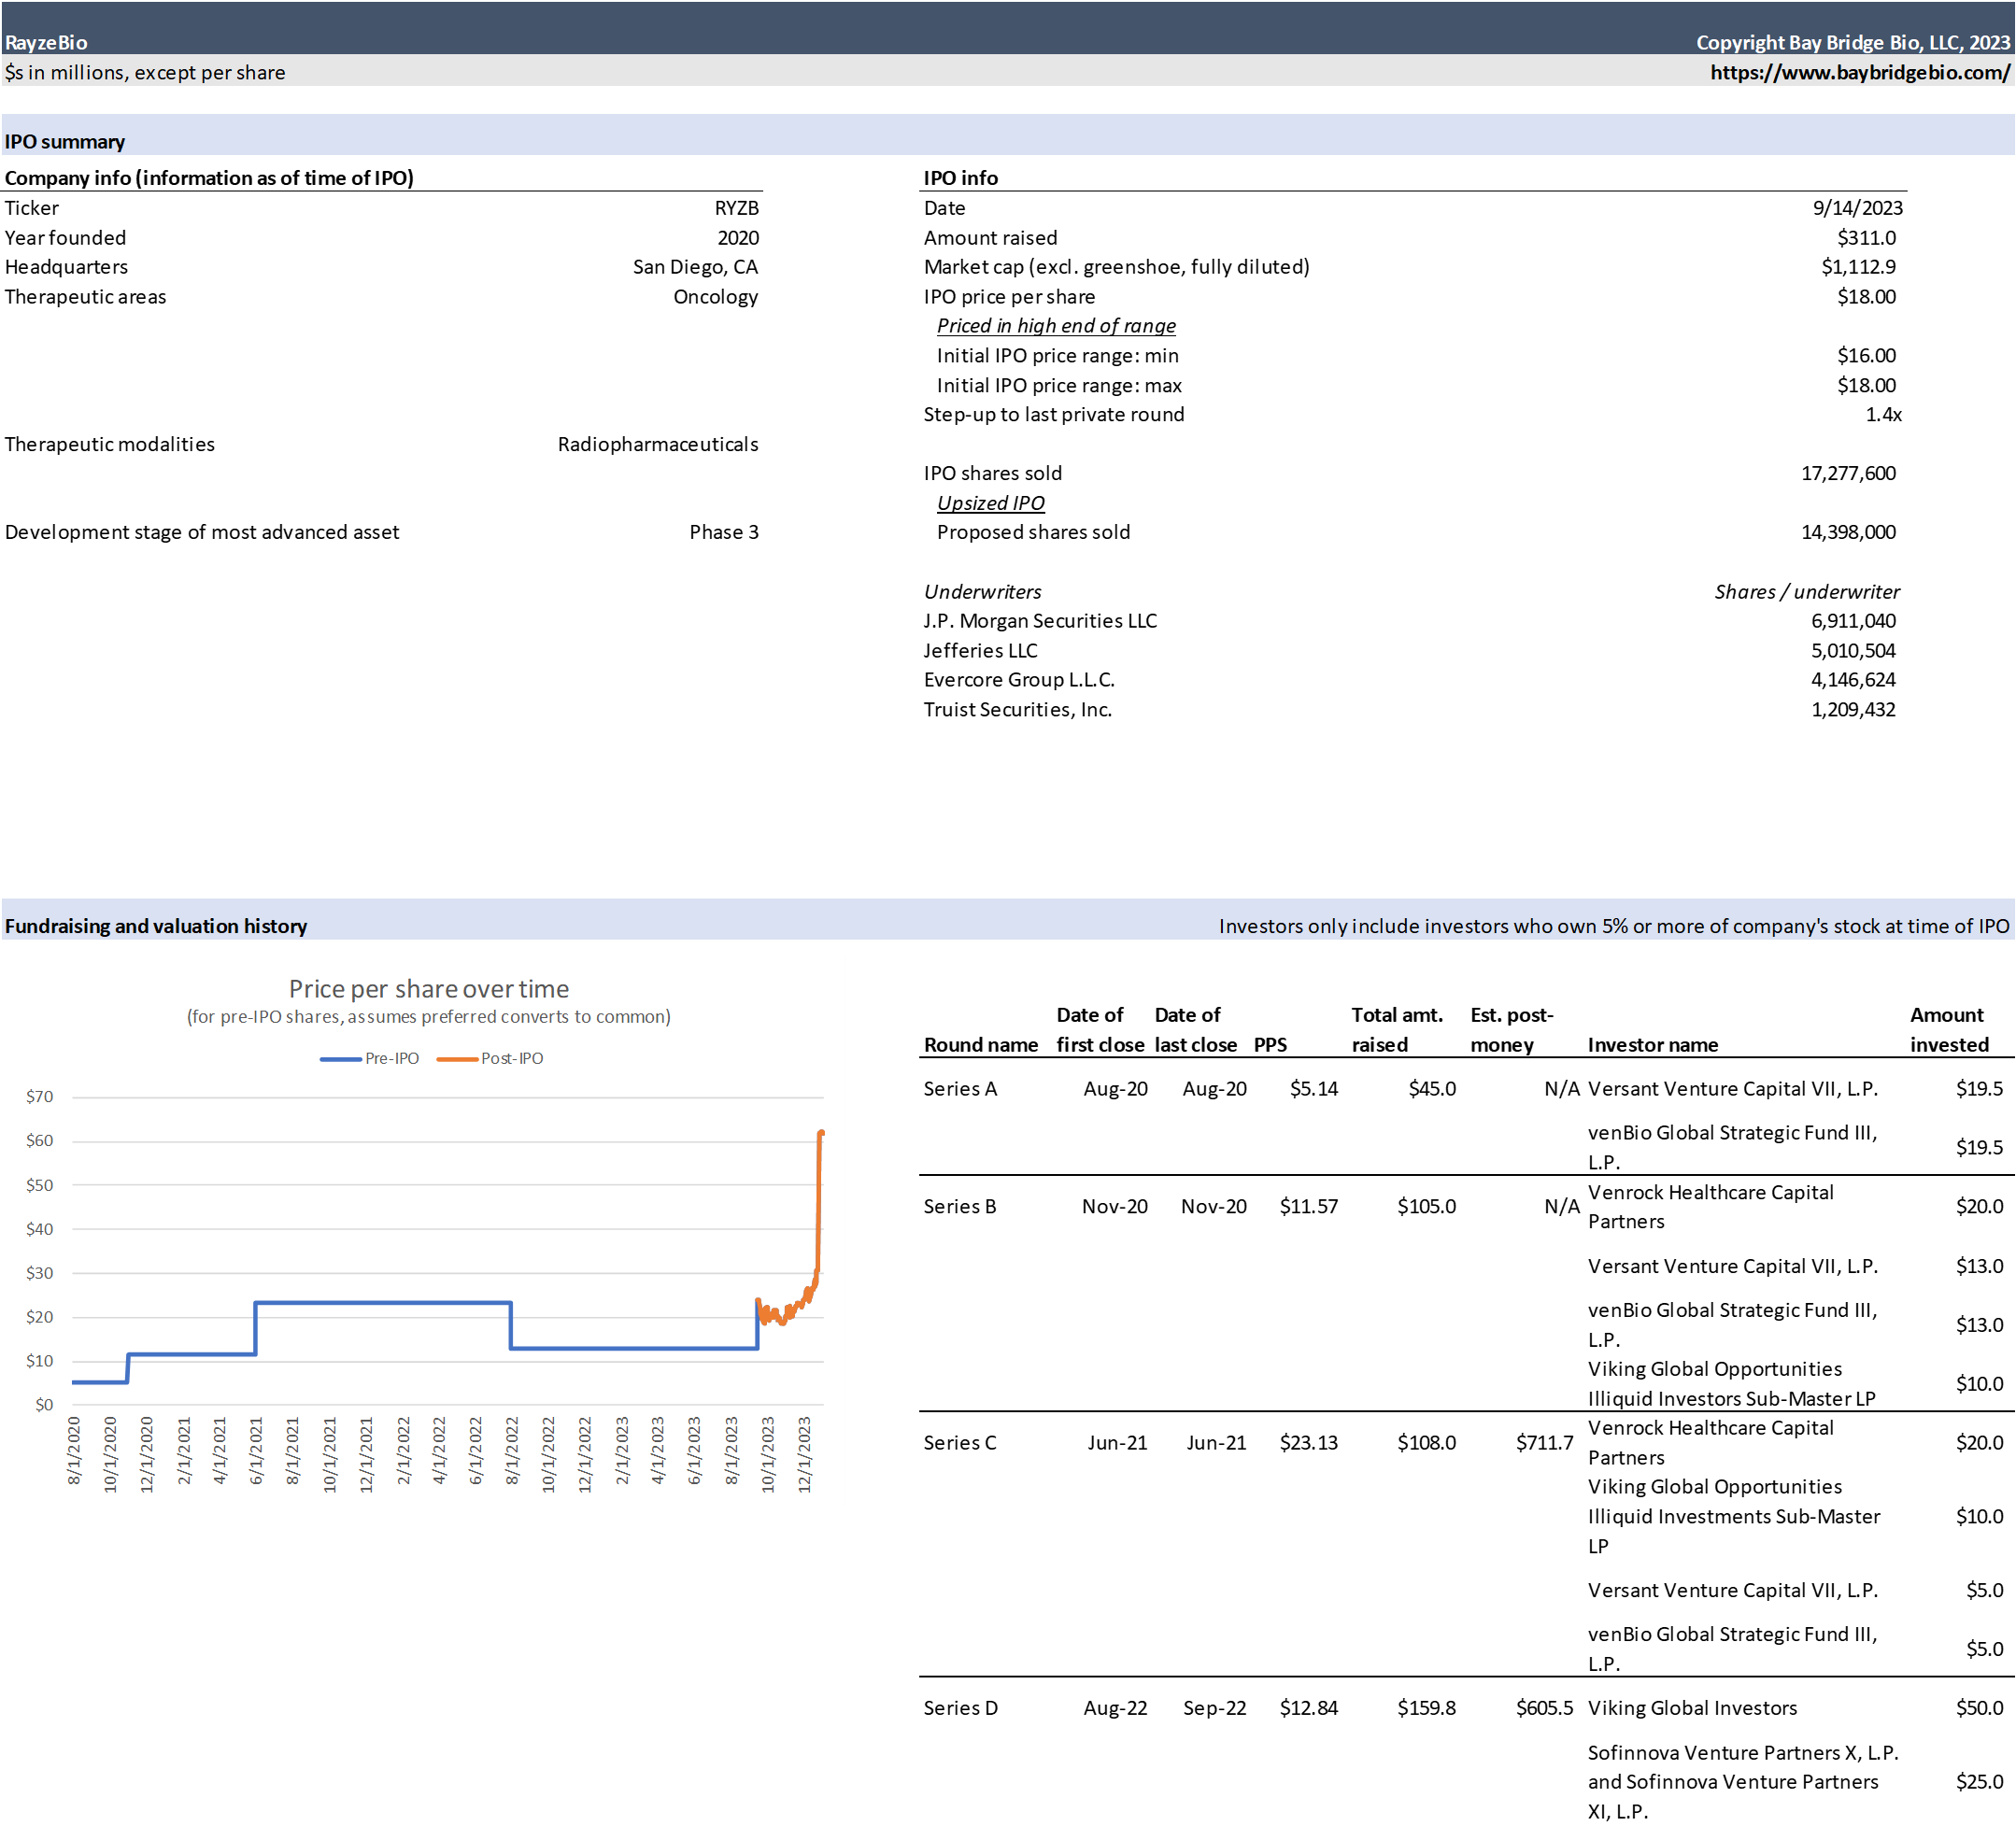
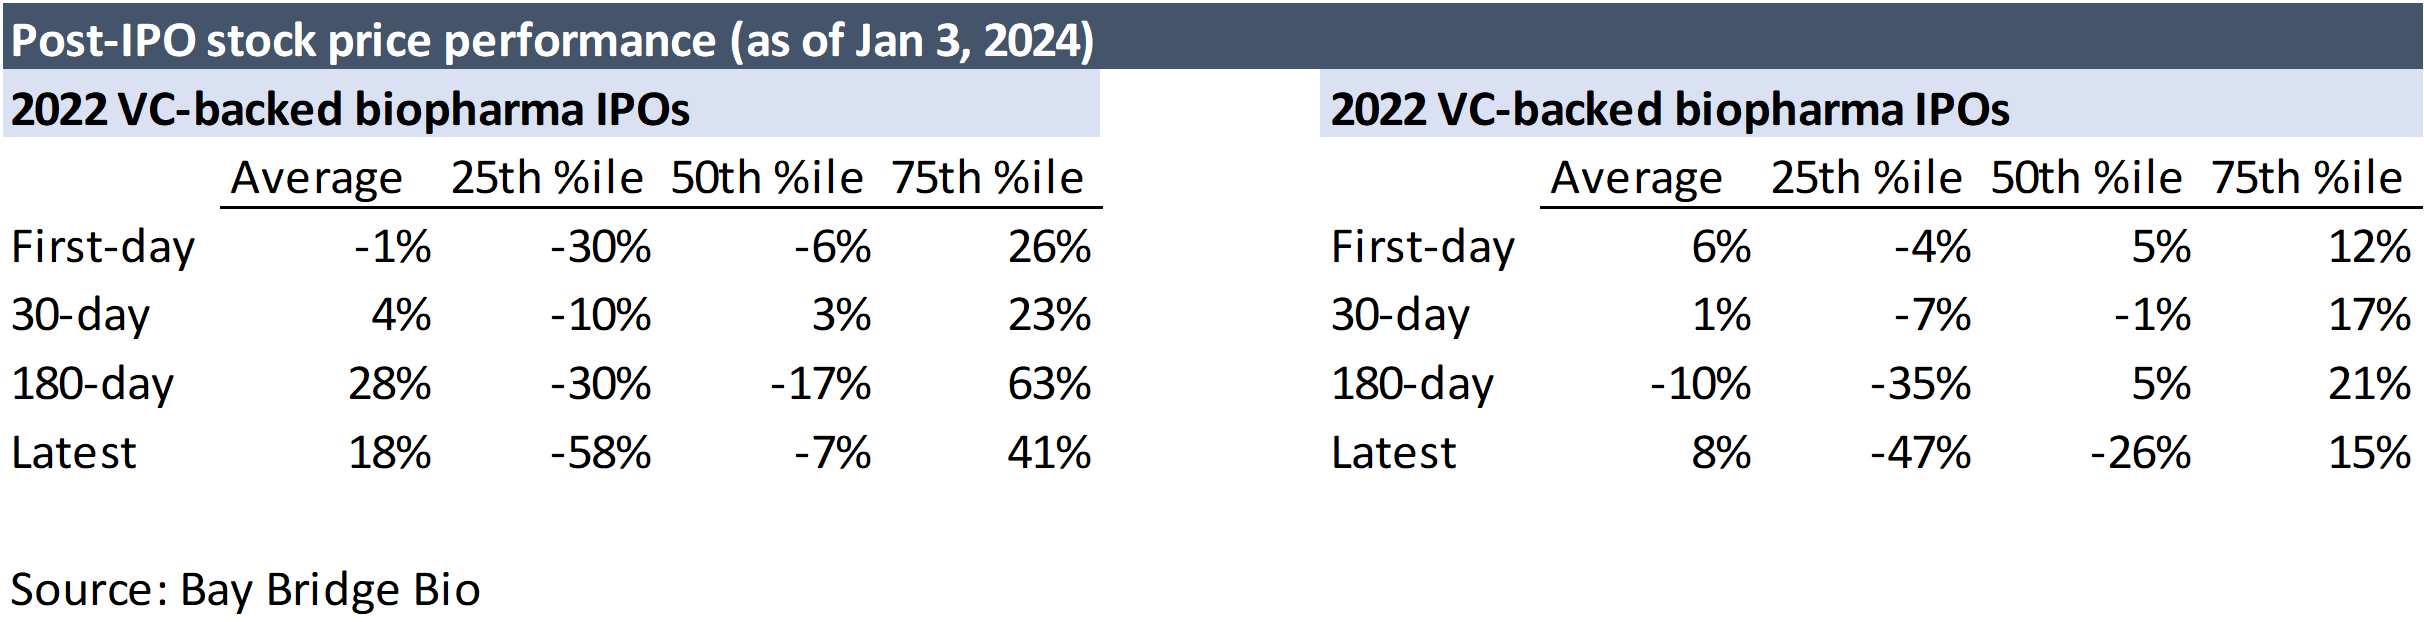
Detailed IPO data
Access detailed data on the 22 VC-backed biopharma IPOs of 2022-2023.
Sample data below. Full data includes excel spreadsheet including the following data for each company:
- Private round valuations
- Price per share over time, from private rounds through post-IPO performance
- Step-up from last private round
- IPO pricing range compared to actual pricing
- Underwriters
- Venture investors and amount invested by investor
- Therapeutic area, modality, development stage
Sample data
Purchase full dataset here