The VC power law: biotech vs. tech
Richard Murphey
When Bruce Booth and Bijan Salehizadeh published their 2011 article in Nature Biotechnology “In defense of life sciences venture investing”, biotech venture was one of the most out-of-favor asset classes in the financial world (the market was wrong about that one, as biotech funds started around this time -- including Flagship’s fund that created Moderna -- were some of the best-performing venture funds of the last decade).
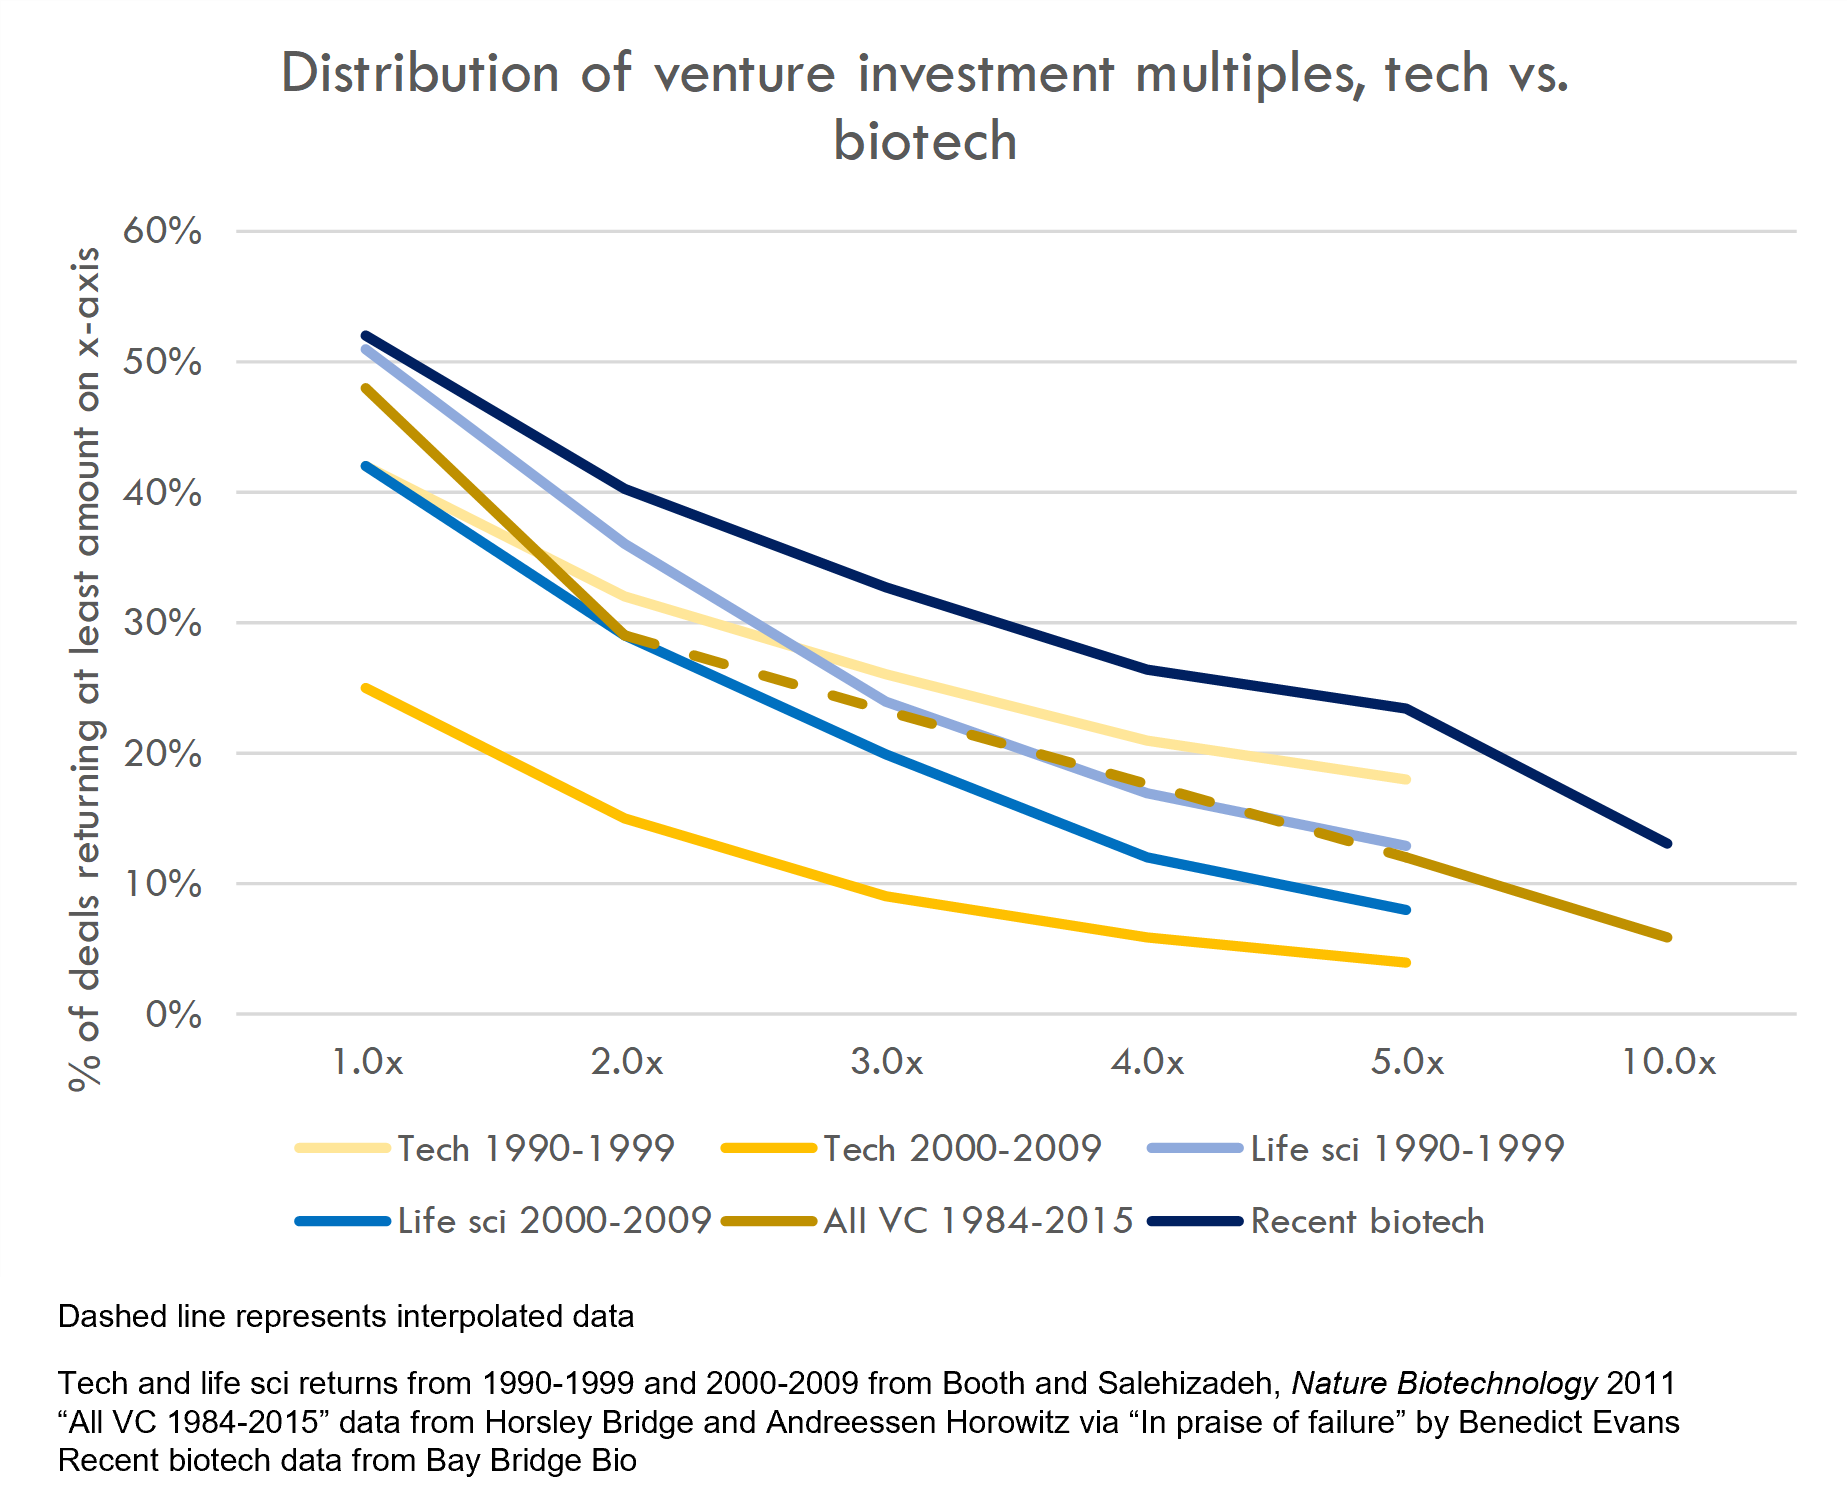
The 2011 article showed that biotech venture had outperformed tech venture over the decade from 2000-2009. They showed that fewer biotech venture investments lost money compared to software, and more biotech venture investments generated 5x+ returns. Both of these groups, however, were handily beat by tech venture investments in the dotcom heyday of 1990-1999: these tech funds had more than twice as many 5x investments as either biotech or tech funds from 2000-2009.
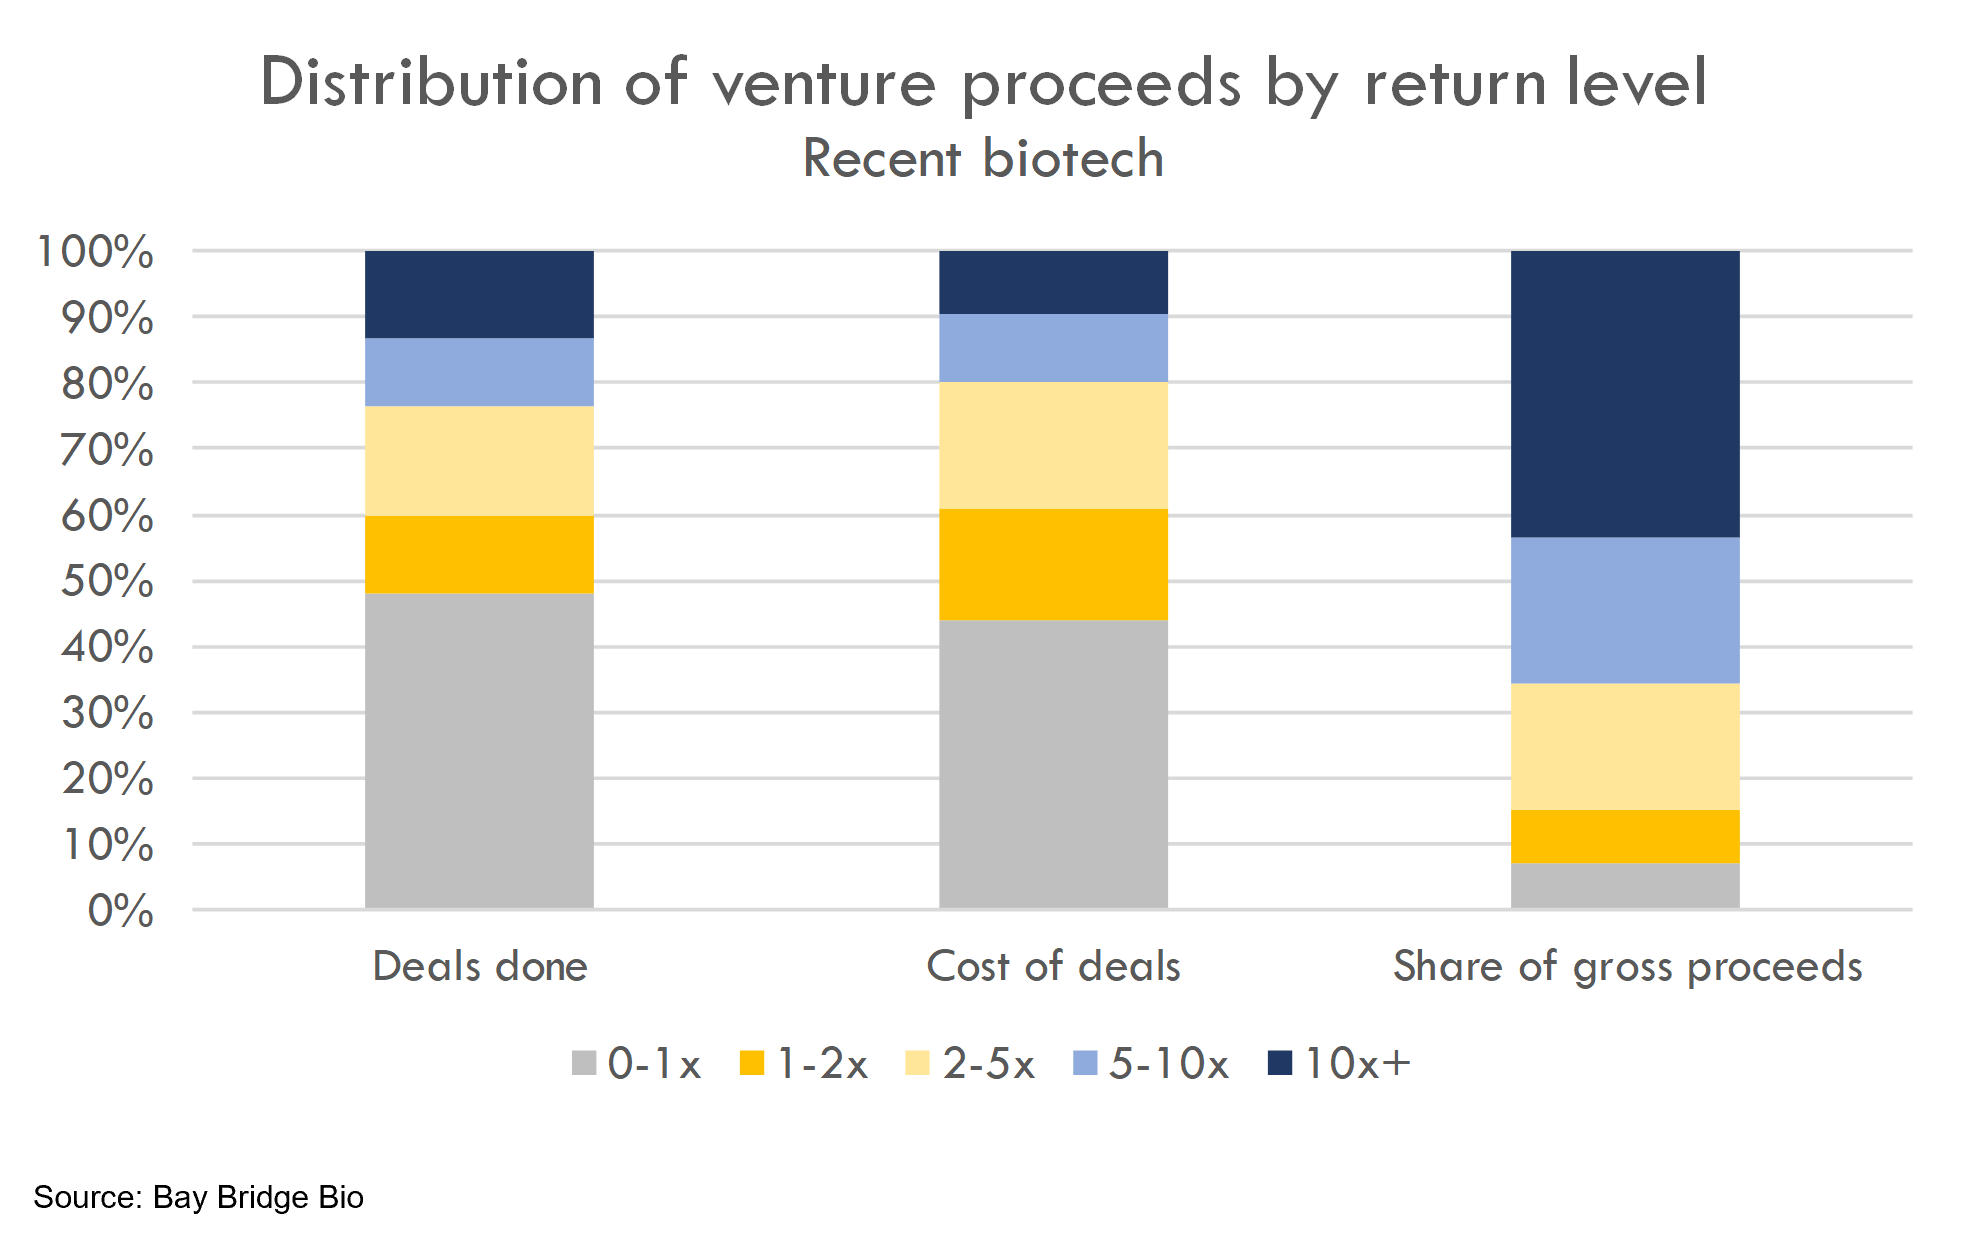
How does this compare to biotech returns today? We analyzed the distribution of returns from recent biotech venture investments and found that the distribution of venture multiples in recent years is even better than the distribution of multiples in the dotcom bubble. As shown in the chart above, almost 25% of biotech venture investments in our sample have returned over 5x (compared to 18% of dotcom-era software investments). See the "Methodology" section below for more detail.
Defensible clinical trial cost estimates
Get transparent cost estimates for any trial in minutes. Input an NCT ID or upload a protocol, then see a full cost analysis report.
This doesn’t mean that overall venture returns in today’s biotech world will be higher than those seen in the dotcom bubble. The above figure looks at the distribution of investment multiples, but not the amount of money generated by these investments. A further limitation is that the highest bucket is just 10x. Venture returns are driven by outliers, and outliers can return 1,000x or more.
In fact, as Benedict Evans showed in a 2016 post analyzing 7,000 venture deals from 1984-2014, 6% of venture investments account for 60% of the returns.
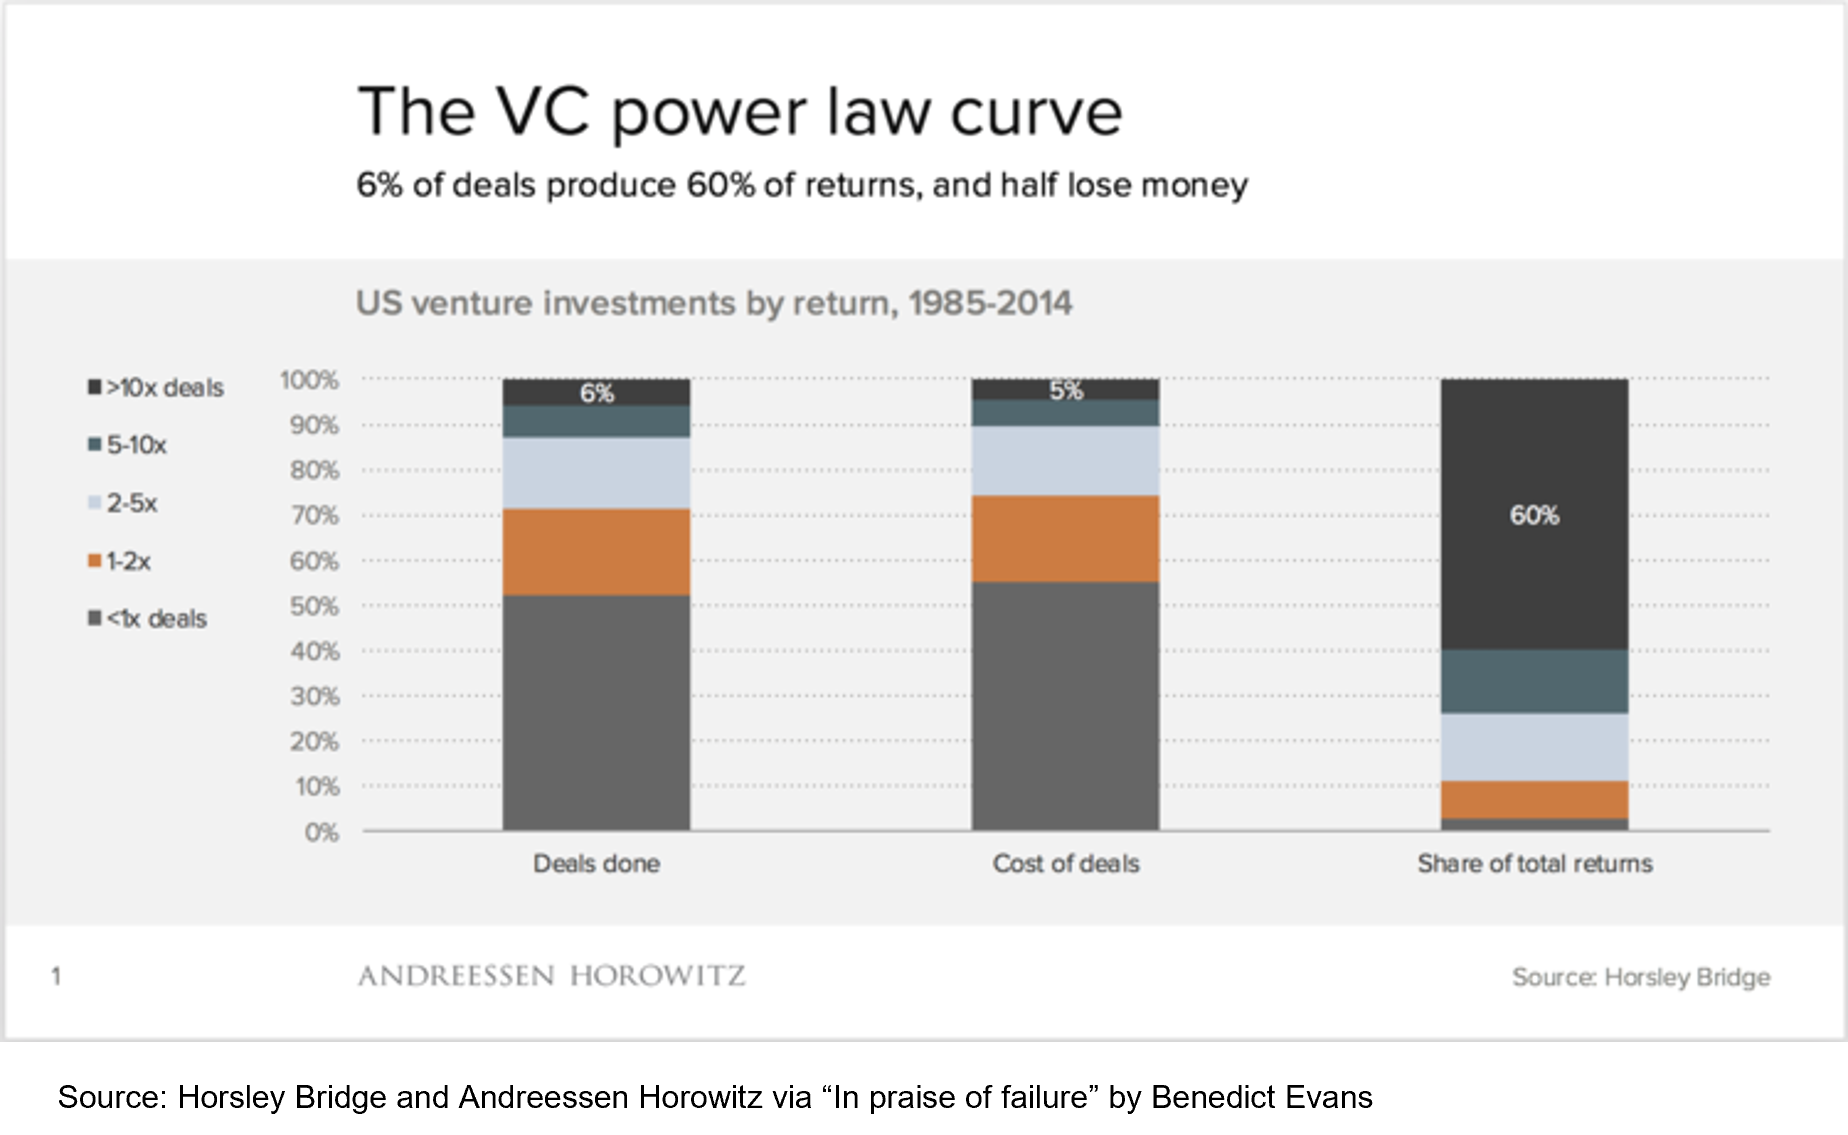
Because of this power law, the first chart in this post doesn't tell the most important part of the story. According to the power law, the distribution of multiples (shown in the “deals done” column of the VC power law curve chart) isn't as important as the size of the winners (shown in the "share of total returns" column).
The outlier successes in 2000-2009 era biotech VC were not very high. If the outlier biotech investments are still small, returns may not be that great, even if many investments generate moderate returns.
So how big are the hits in biotech?
It turns out that the hits are pretty big. Not quite as big as in tech, but bigger than I had expected:
- 13% of biotech VC deals generate 62% of the proceeds
- 6% of all VC deals generate 60% of the proceeds
If we examine the data more closely, we find that one particular company generated a huge share of biotech VC proceeds:
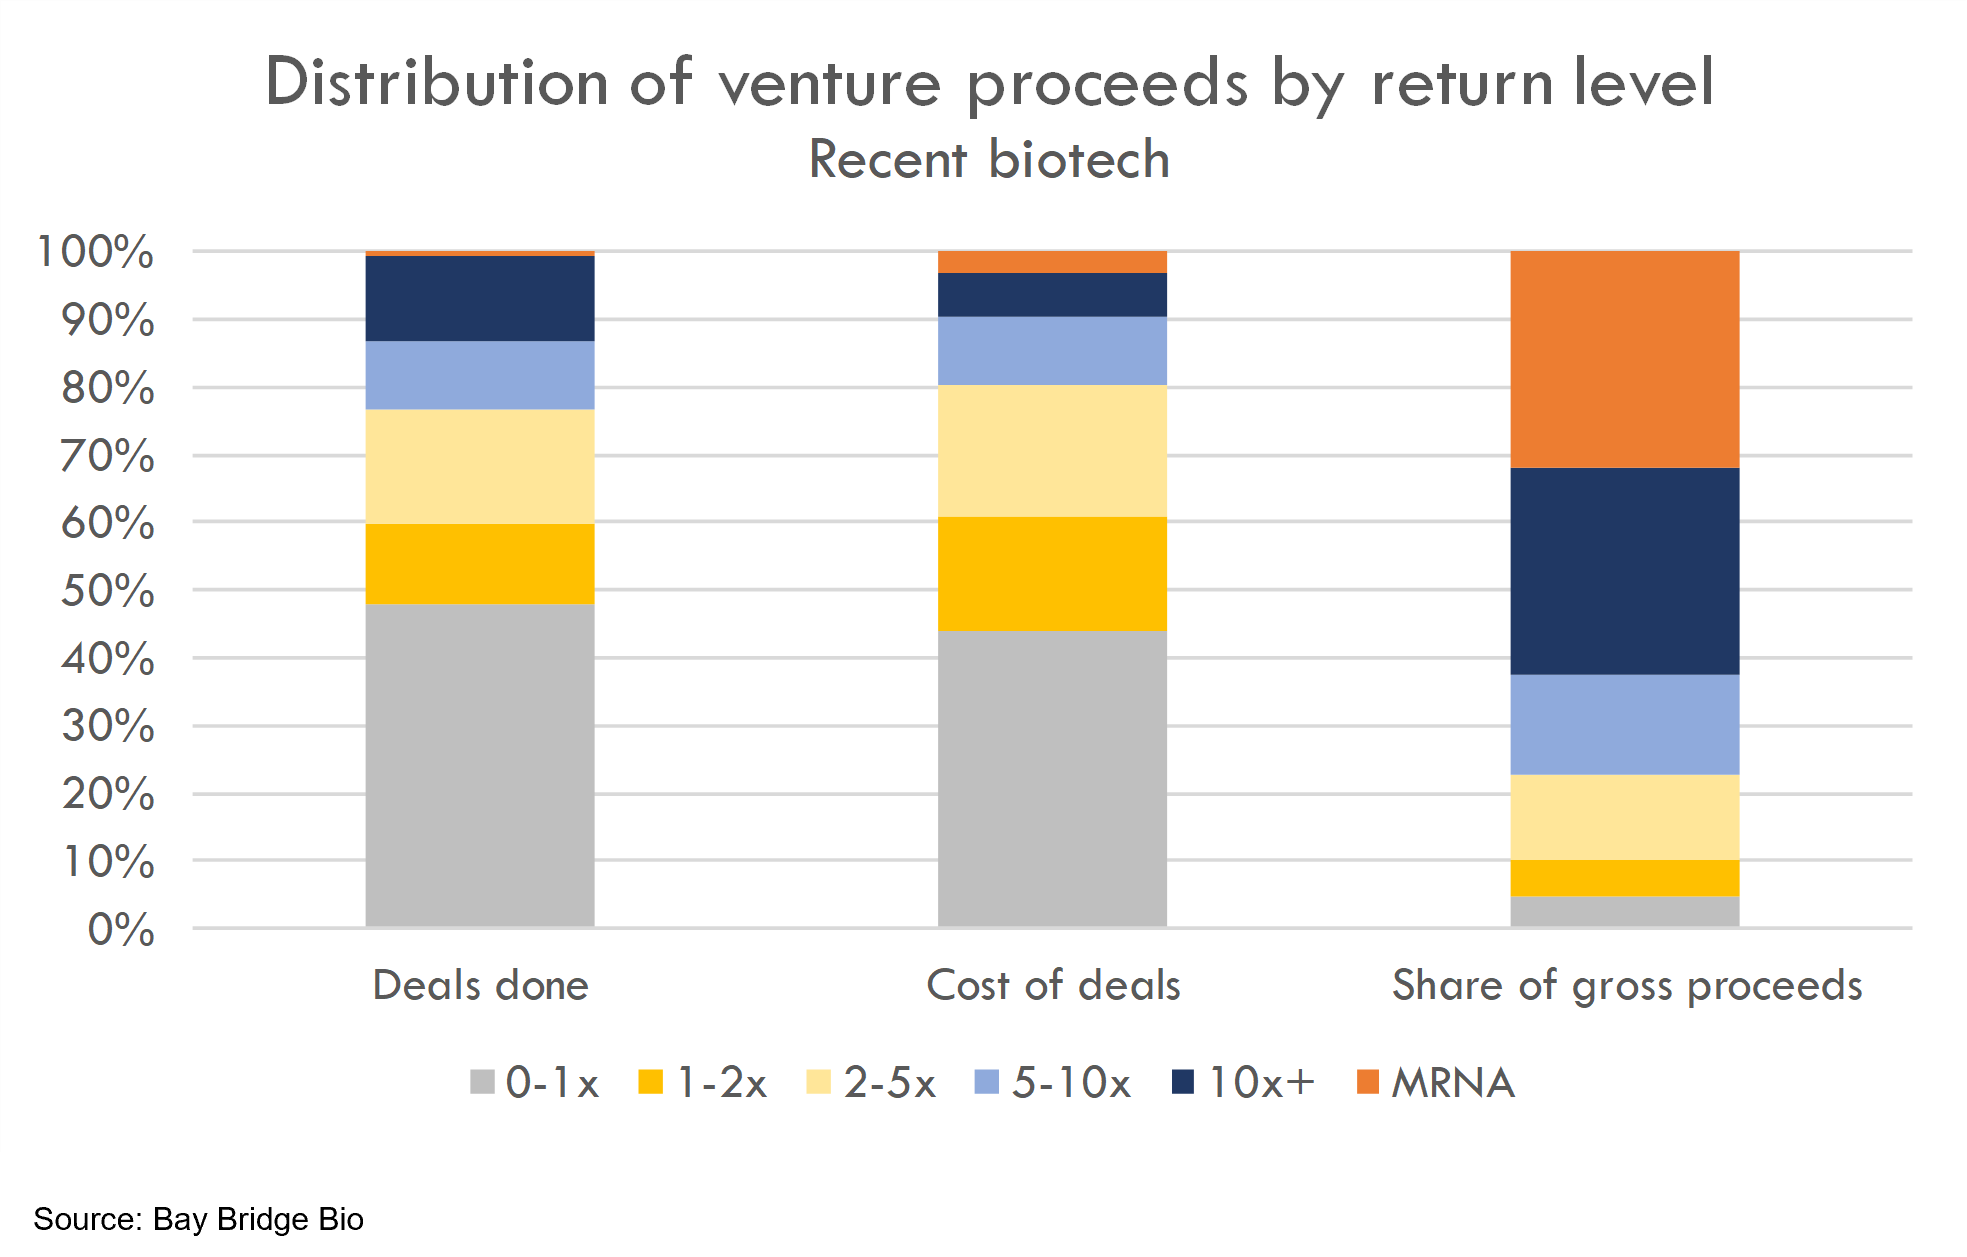
Moderna accounts for 30% of total proceeds generated by biotech VC exits from January 2018-August 2021. Obviously, this is because of Moderna’s COVID vaccine.
VC investing relies on outliers, so excluding outlier returns isn’t an accurate way to analyze the asset class. But in this case, it’s worth looking at VC returns excluding MRNA’s COVID gains. Moderna seems an outlier even among outliers: a company that achieved a near-duopoly position in a brand-new market with a market size of nearly every human on the planet. If the pandemic is a once-in-a-century event, it is even more rare that only two companies on the planet (and relatively small companies at that) have the ability to rapidly develop a treatment for a once-in-a-century disease.
To adjust for this outlier among outliers, we calculated the same distribution of returns but used MRNA and BNTX’s share price in January 2020 before they announced they were working on COVID (MRNA was an $7B company at the time, in-line with other next-gen platform leaders, but below its 2018 IPO valuation and well below its current valuation).
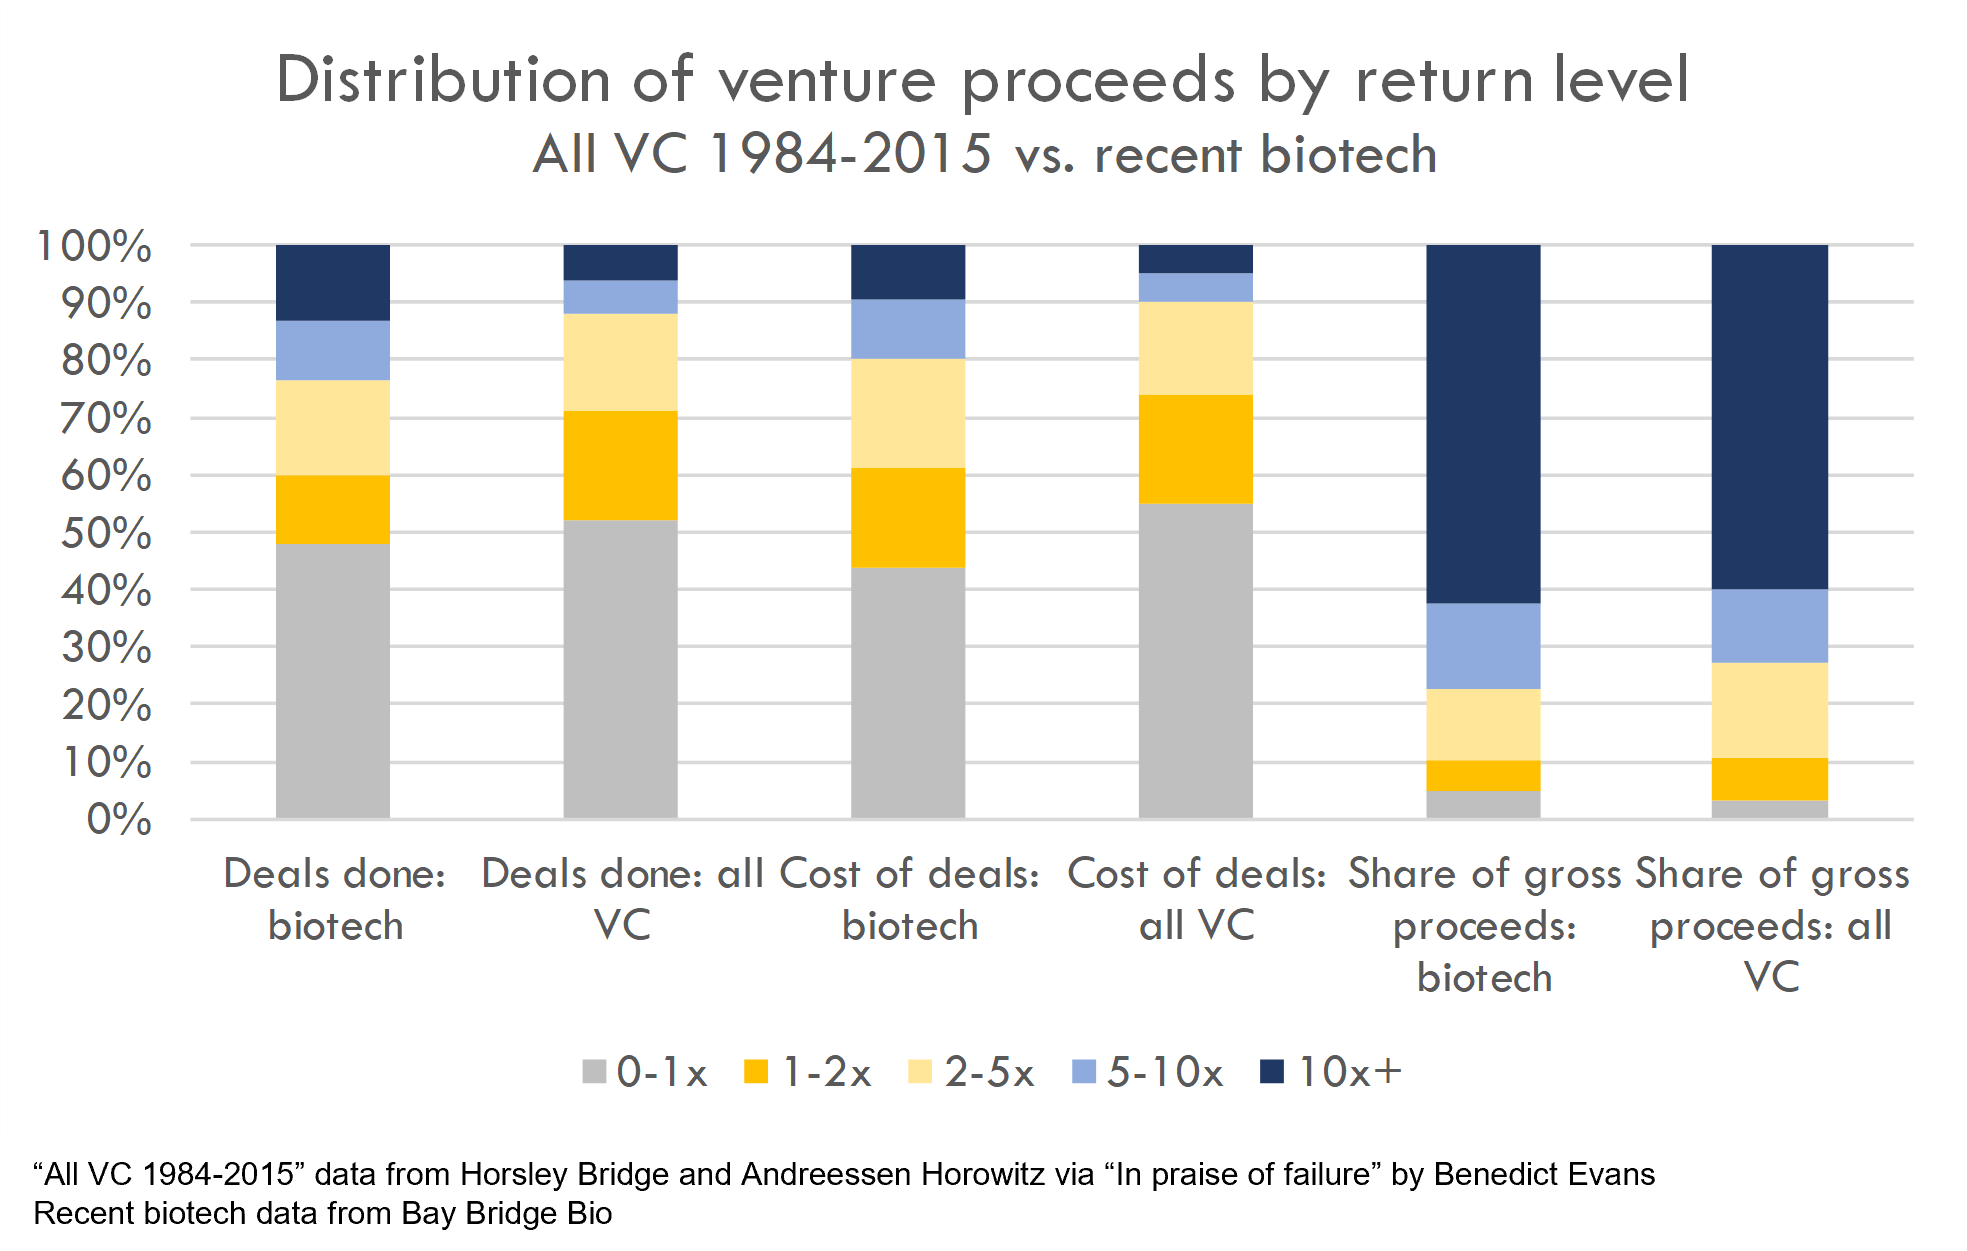
The distribution of returns excluding MRNA and BNTX’s COVID price jump is much less concentrated:
And compared side-by-side to the Horsley Bridge / a16z chart:
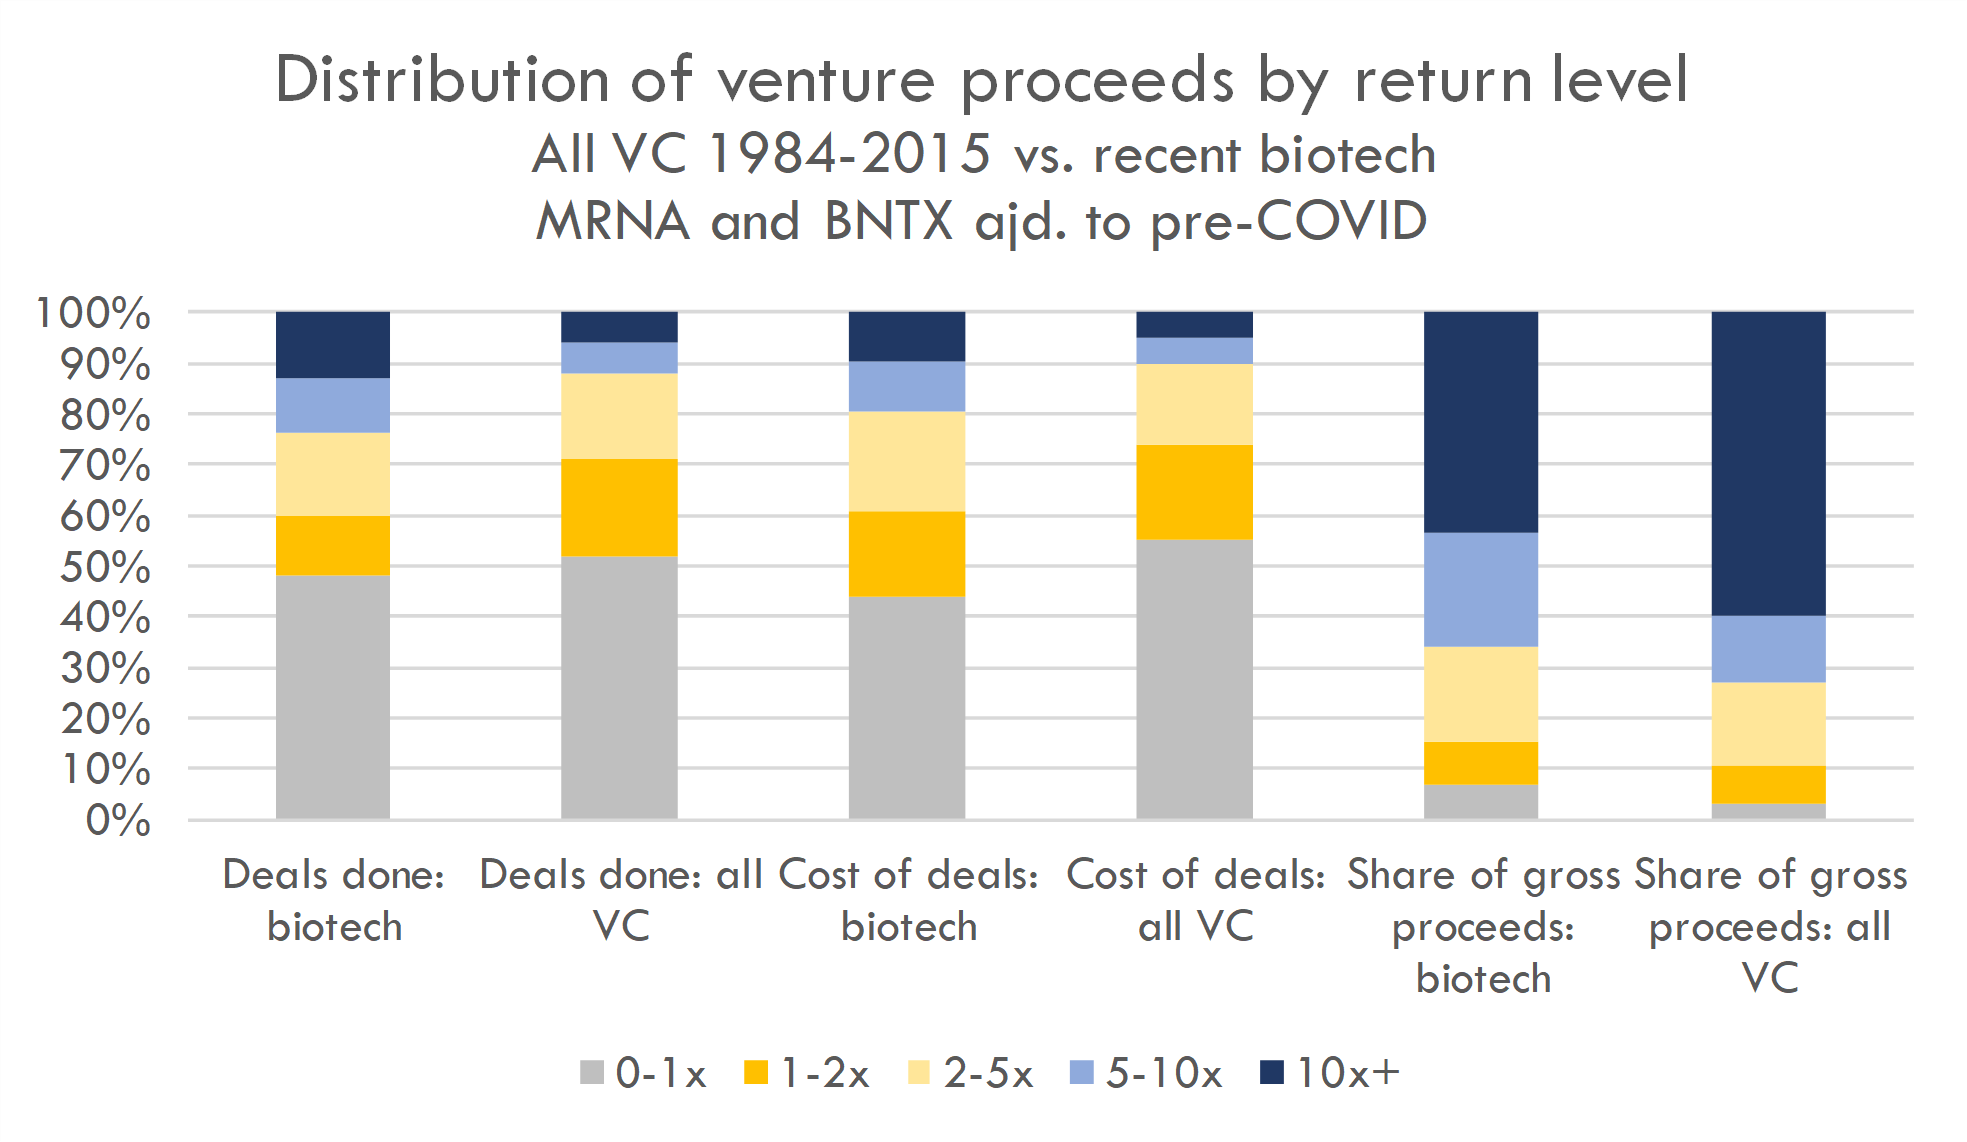
In this analysis, 13% of the biotech VC deals account for 43% of the returns.
Structuring biotech vs. tech VC portfolios
What are the takeaways? Unless they are betting on another pandemic, biotech VCs should not structure their portfolio like tech VCs. In biotech, the winners aren’t as big, so biotech portfolios need lower loss rates and more singles and doubles than software venture portfolios.
On the other hand, biotech VCs can afford to take much more risk than they could in the 2000s. And in a competitive market, they will need to take more risk, or risk falling behind.
And biotech investors are taking more risk. Later stage investors are moving earlier stage, with hedge funds, LPs and other generalist investors taking share from traditional VCs (much like Tiger Global is taking over software VC). Early-stage VCs are betting on increasingly risky science, and even expanding into more challenging areas of biotech like diagnostics and industrial biotech. The level of risk-tolerance is so high that the most scientifically ambitious (and risky) companies often attract the highest valuations -- everyone wants to get in on the next big platform.
Rising valuations decrease reward without changing risk. Investors may consider looking to less frothy areas of the market to find deals with better risk / reward profile. As readers of this blog have heard me say before, many biotech VCs would do well to take on more management risk -- and they may find that, if they pick the right founders, inexperience is not a risk at all, but an asset.
But betting on quality of the team isn't enough -- biotech venture investing requires considerably more time spent diligencing investments that software investing. When the big winners aren't as big, investors need to have more moderate winners to generate an acceptable portfolio-level return. This means biotech investors should spend more time on diligence and less time on finding and fighting for allocations in hot deals than should software investors.
Defensible clinical trial cost estimates
Get transparent cost estimates for any trial in minutes. Input an NCT ID or upload a protocol, then see a full cost analysis report.
Methodology
We calculated the cash-on-cash returns for 635 venture investments in VC-backed biopharma (and select tools and software) that went public (and raised at least $50M in the IPO) or were acquired while public from January 2018-August 2021. For companies that remain public, we calculated returns based on close prices at the end of August 2021. As we did not have access to valuation data for all deals that exited via M&A while still private, we estimated the returns of private M&A deals based on acquisition consideration, number and amount of venture capital raised prior to acquisition, and average ownership acquired at each round. Private M&A deals made up under 10% of exited deals in our sample, as most exits were IPOs.
As we did not have access to returns data for all investments that failed, we estimated returns for “failed” investments using the percentage of biopharma venture investments in 2018 that failed to raise another round or exit as the “zombie rate” for each series of investment (Series A, B, late stage and other). We used this zombie rate to determine the number of zombies to add based on the proportion of zombies / zombies + exited companies in 2018. To estimate the amount raised by the zombie companies, we determined the best-fit distribution for amount raised in Series A, B, etc. investments in our sample of exited companies, and we modeled amounts raised by zombies using this distribution. We estimated zombie returns using the distribution of returns for companies that went public but returned less than 1x.
You may also like...
Top biotech VCs of 2018 and 2019
Valuing drugs and biotech companies
Venture returns from biopharma IPOs, 2018-Q1 2019
Valuations of biotech startups from Series A to IPO
Did you enjoy this article?
Then consider joining our mailing list. I periodically publish data-driven articles on the biotech startup and VC world.