Biotech crossover investors facing steep losses
June 5, 2022
The biotech market crash has been hard on crossover investors.
Crossover investors provide a bridge from private to public markets: they invest in the last private round of companies, then flip them to the public markets via an IPO. These investors thrived during the IPO boom of the last decade, playing a key role in helping biotech startups access larger pools of capital.
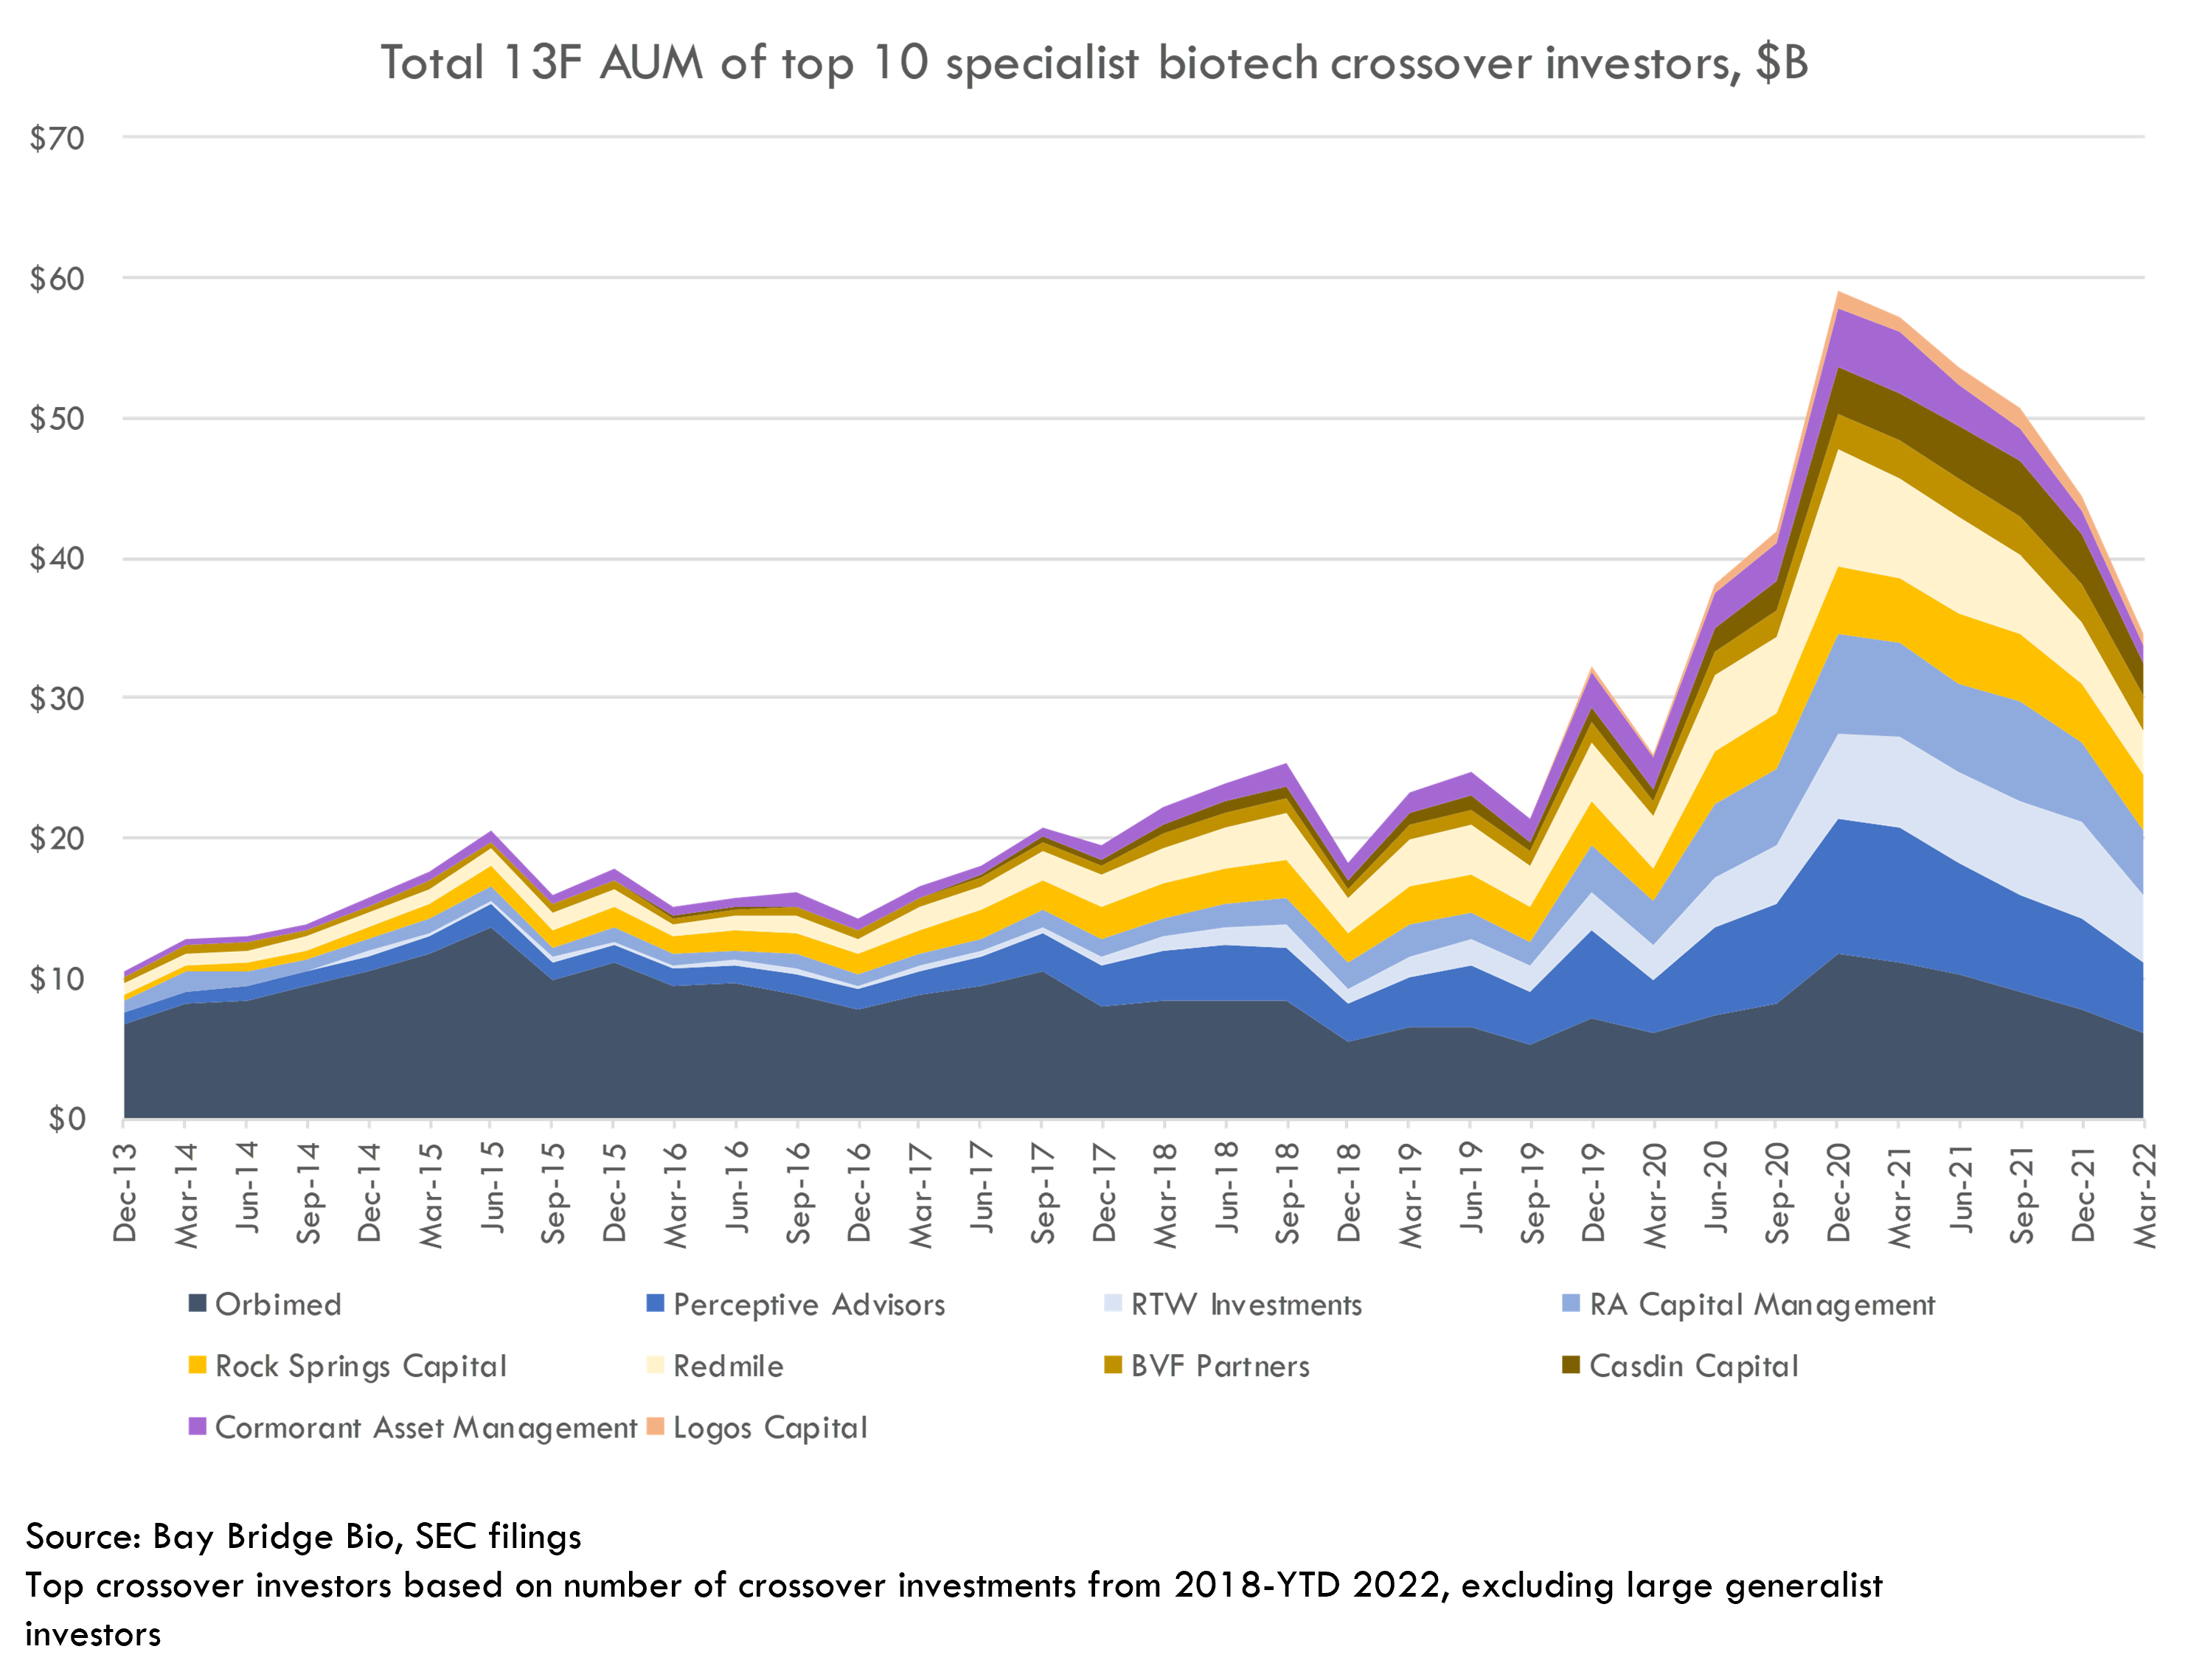
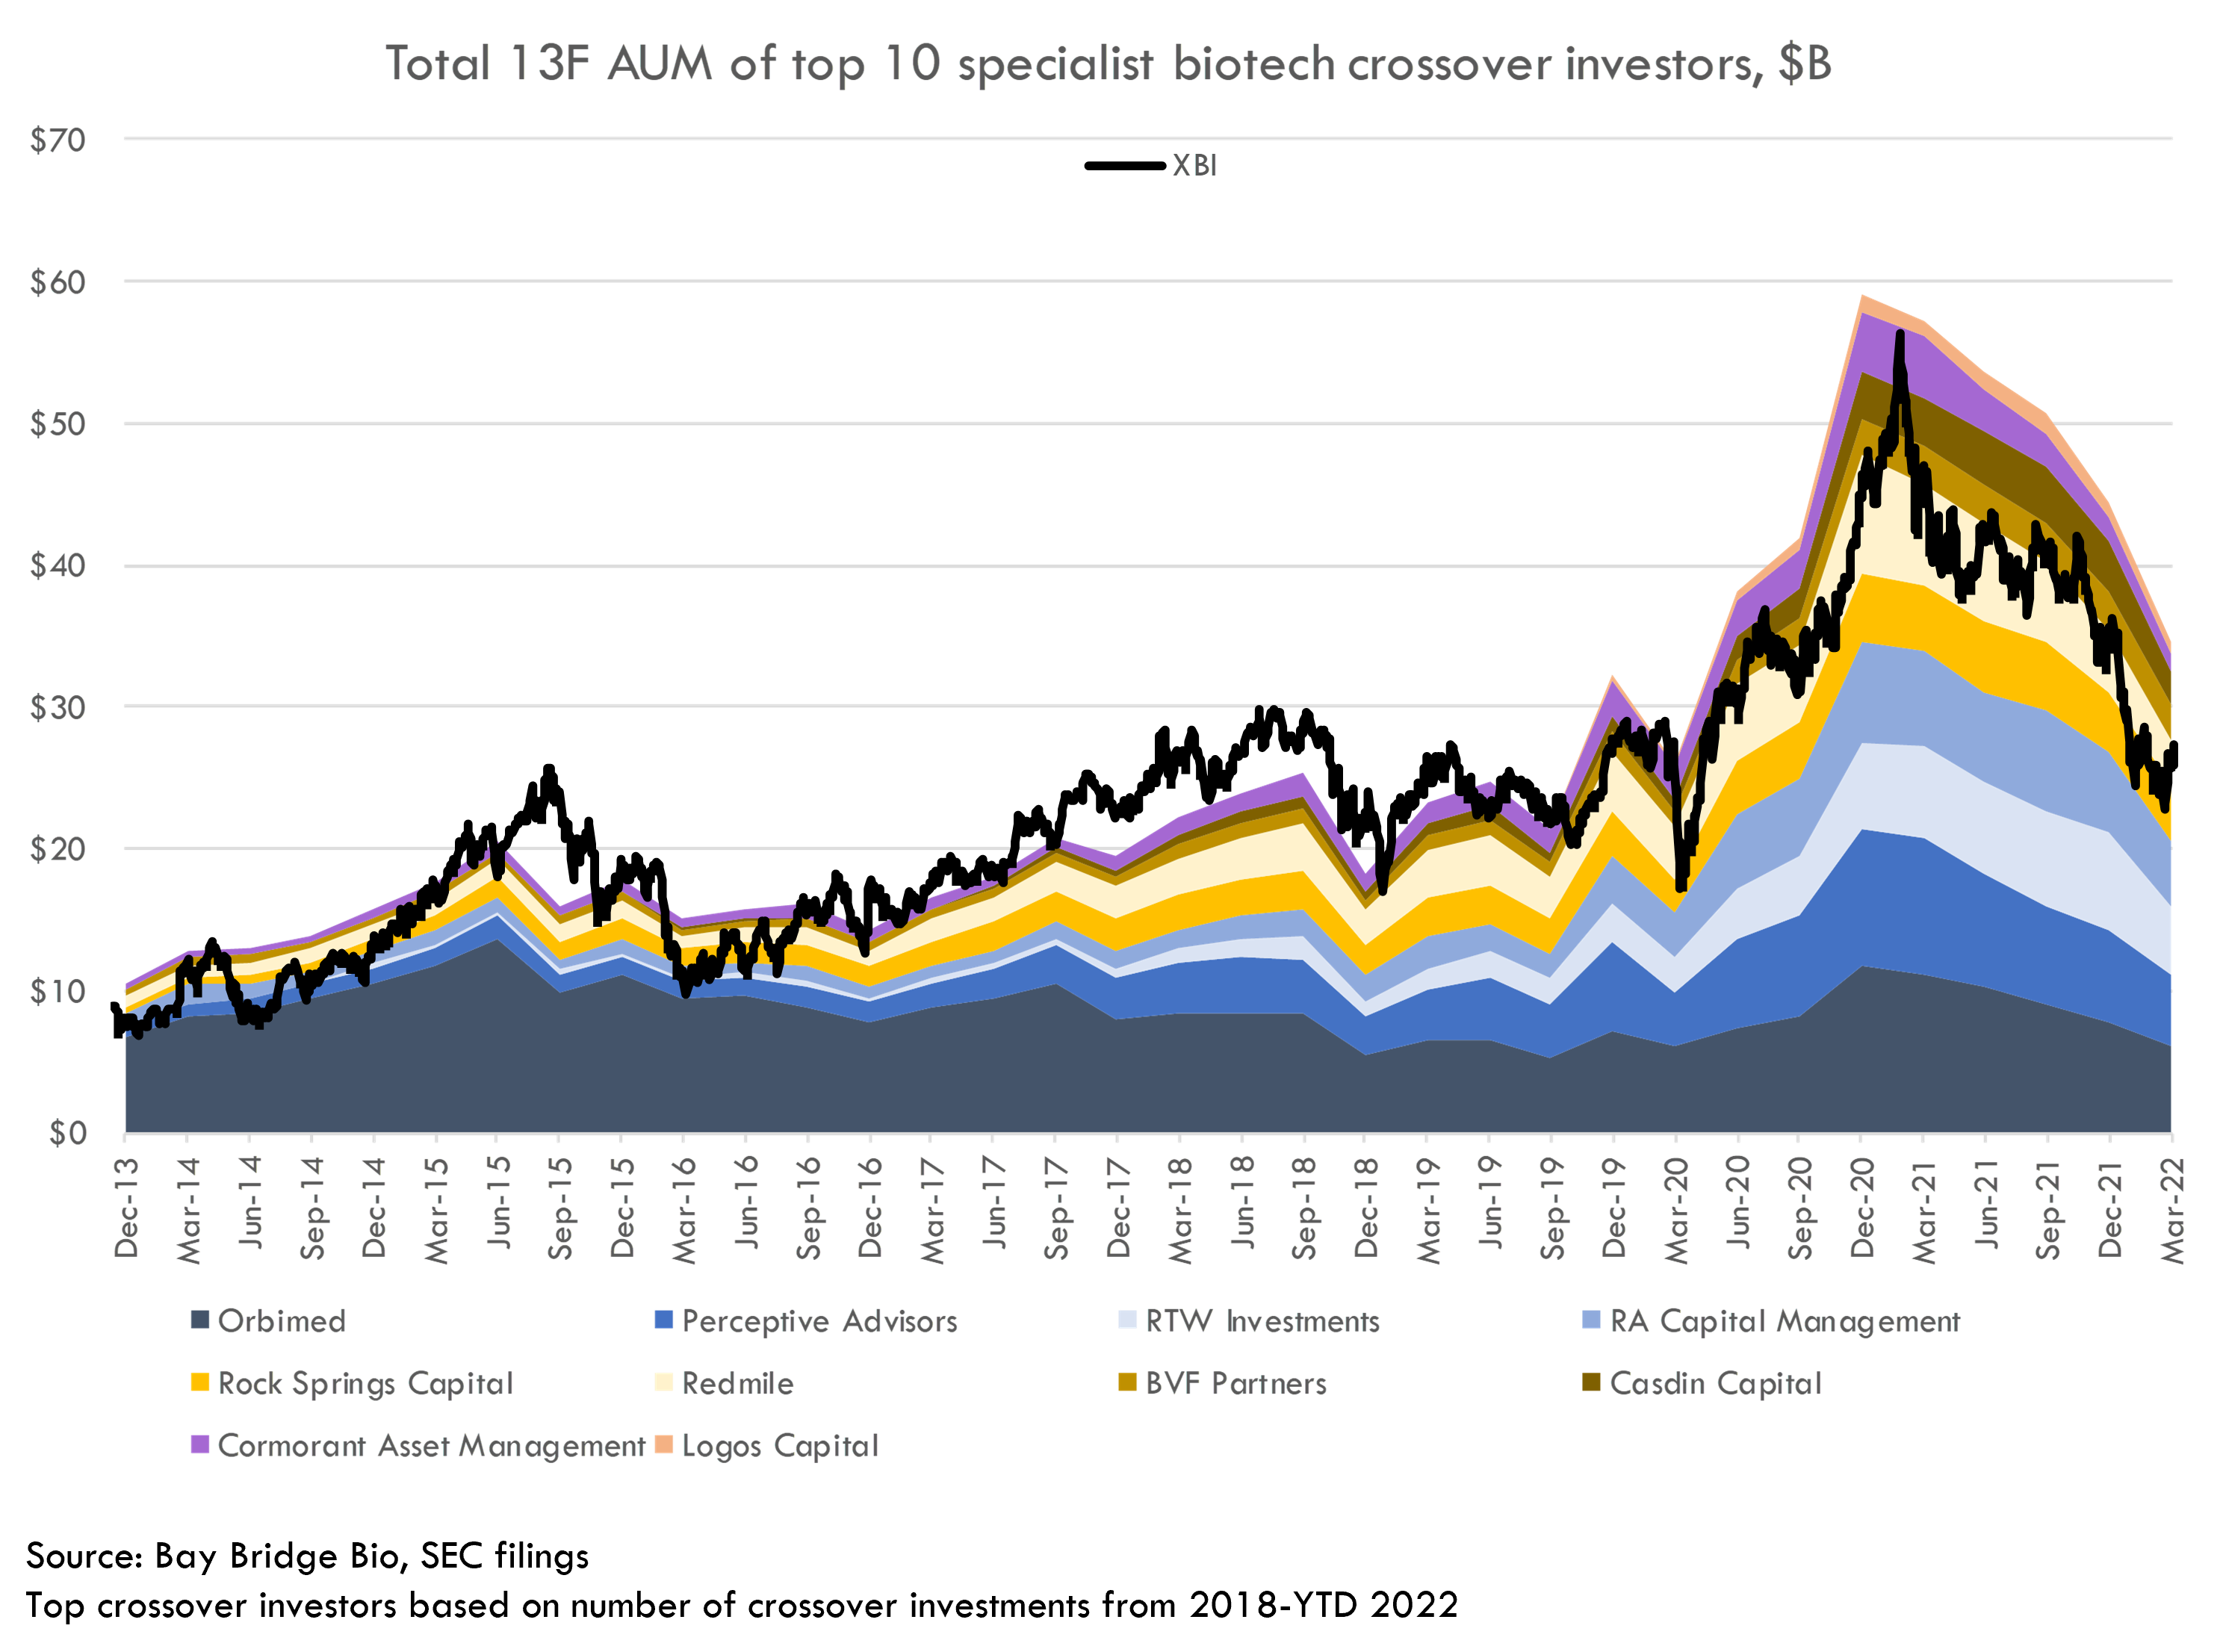
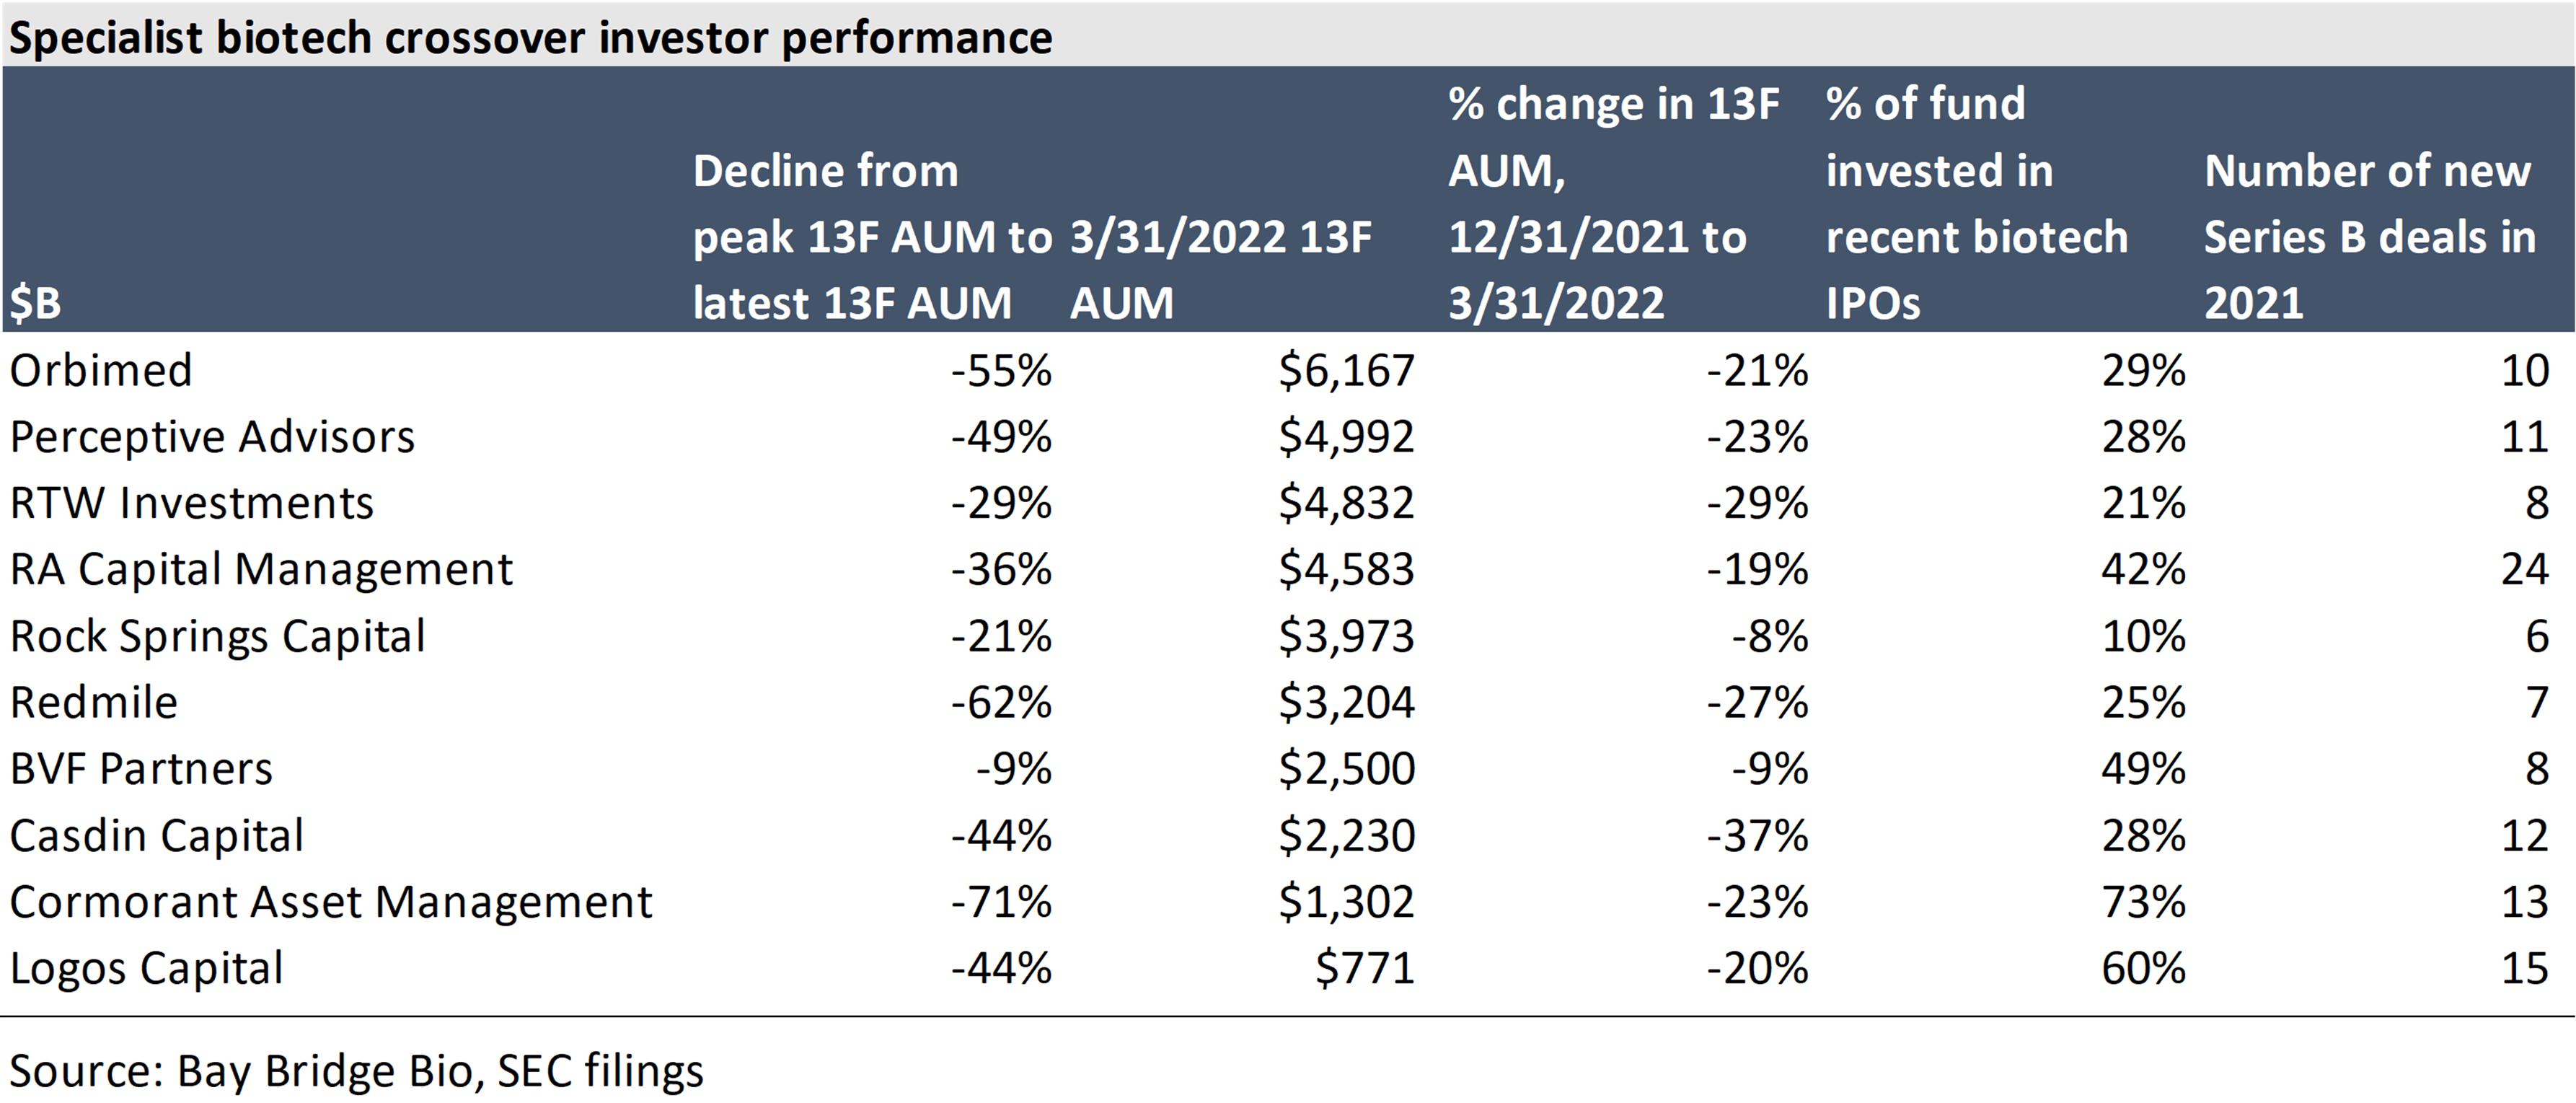
The total 13F assets managed by the top 10 specialist crossover funds ballooned from $26B in Q1 2020 to $60B+ in Q1 2021 1, 2.
The decline has been just as fast. These investors' total 13F AUM has dropped by more than 40% from the peak to the latest 13F. Losses through today (June 5, 2022) are likely significantly greater, as the XBI is down an additional 25% since March 31 (the end of the period covered by the most recent 13F filings).
These 13Fs don’t tell the whole story. They don't include short positions, and they don't cover private investments 1. Many of these crossovers manage more private capital than public. Public market malaise is slower to reach private portfolio valuations because of how private funds value their portfolios, so private portfolios are somewhat insulated as of now. But private portfolios will experience challenges unless public markets turn around.
The role of crossover investors
Over the last decade, crossover investors blazed a new trail for innovative biotech companies to raise capital and develop medicines. In addition to directly investing in companies, they also help private companies access the much larger pool of capital that exists in public equity markets. These crossover investors helped fund many innovative medicines that may not have succeeded without their help, from Moderna and BioNTech / Pfizer’s COVID vaccines to AveXis’ gene therapy cure for a fatal genetic disease (and dozens of others).
Without crossover and venture investors, new drugs don't get developed. Big pharma increasingly relies on small companies to replenish its R&D pipelines, and there is not enough public funding of biomedical R&D to fund anything but the earliest stages of drug research.
These investors (as well as venture capital investors) play an important, but fragile, role in the global healthcare system, striking a careful balance between taking risk to enable development of new medicines, and investing with discipline to ensure the financial system is sustainable. The current correction is a result of that balance being disturbed by a decade-plus of easy money from the Fed, but a healthy dose of discipline will ensure funding markets can recover and continue to support biomedical innovation.
The rise of crossover investors
The biotech IPO market was frozen from 2007-2009. The IPO window cracked slightly open starting in 2010, and then flew wide open starting in 2013. Crossover investors were instrumental in developing and maintaining a path to public markets for biotech startups via IPO.
The biotech IPO boom had two phases: from 2010 to 2016, and from 2017 to 2021. The first phase of the IPO boom, from 2010 to 2016, saw the IPO market reopen, then peak as the XBI entered a bubble in 2015, and then slow after the bubble popped.
During this phase, Orbimed was the dominant biotech hedge fund and crossover investor. The other 9 of today’s top 10 crossover investors combined managed roughly half of Orbimed’s AUM:
The easiest way to build DCF models
Build robust biotech valuation models in the browser. Then download a fully built excel model, customized with your inputs.
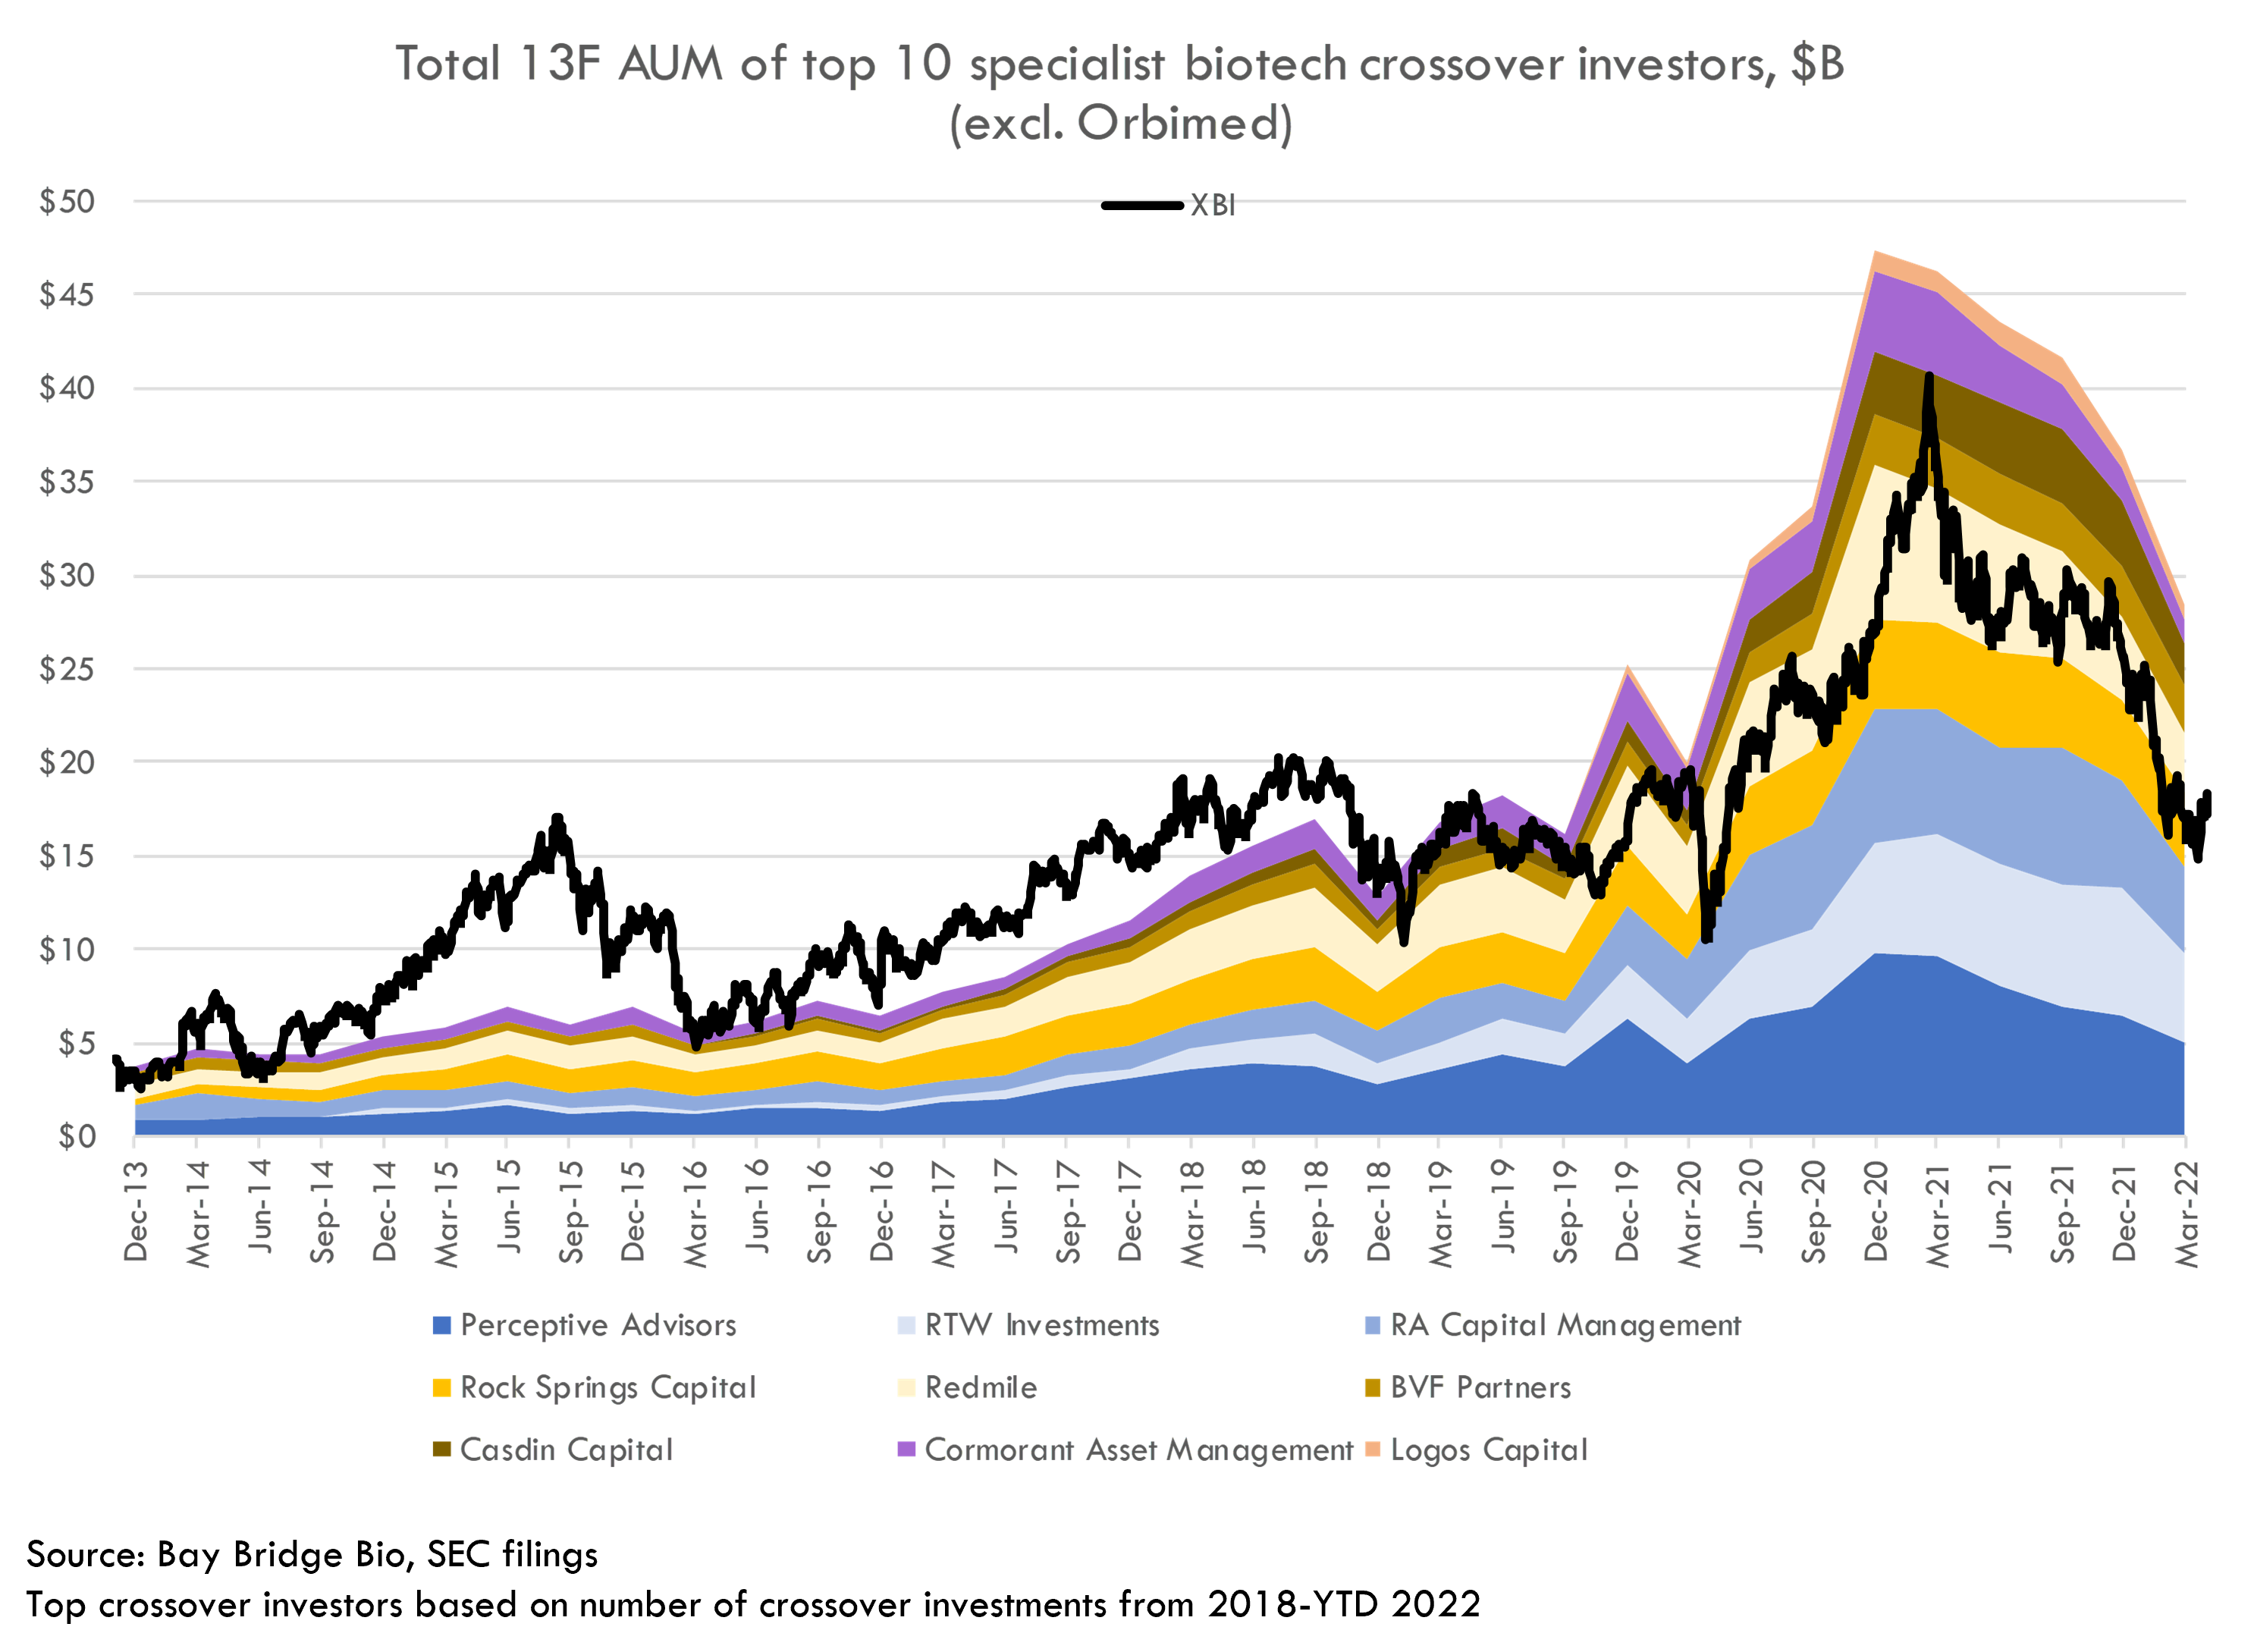
These investors weathered the 2015 bubble fairly well (whether by luck or skill we can’t know – we are looking at the top crossover investors of recent years, so there is inherent survivorship bias). On the other hand, Orbimed’s AUM declined steadily after the bubble popped, only increasing again during COVID. Orbimed’s 13F AUM has never again reached the peak it achieved during the 2015 bubble, although the firm is still the largest biotech specialist manager with $18B managed across all funds including its private funds.
The second phase of the IPO boom started in March of 2016, after the Federal Reserve allayed market’s fears of a rapid rise in interest rates. This change in Fed policy led to an instantaneous turnaround in biotech stocks. The IPO market soon recovered as well.
Supply-demand imbalance leads to rising IPO valuations
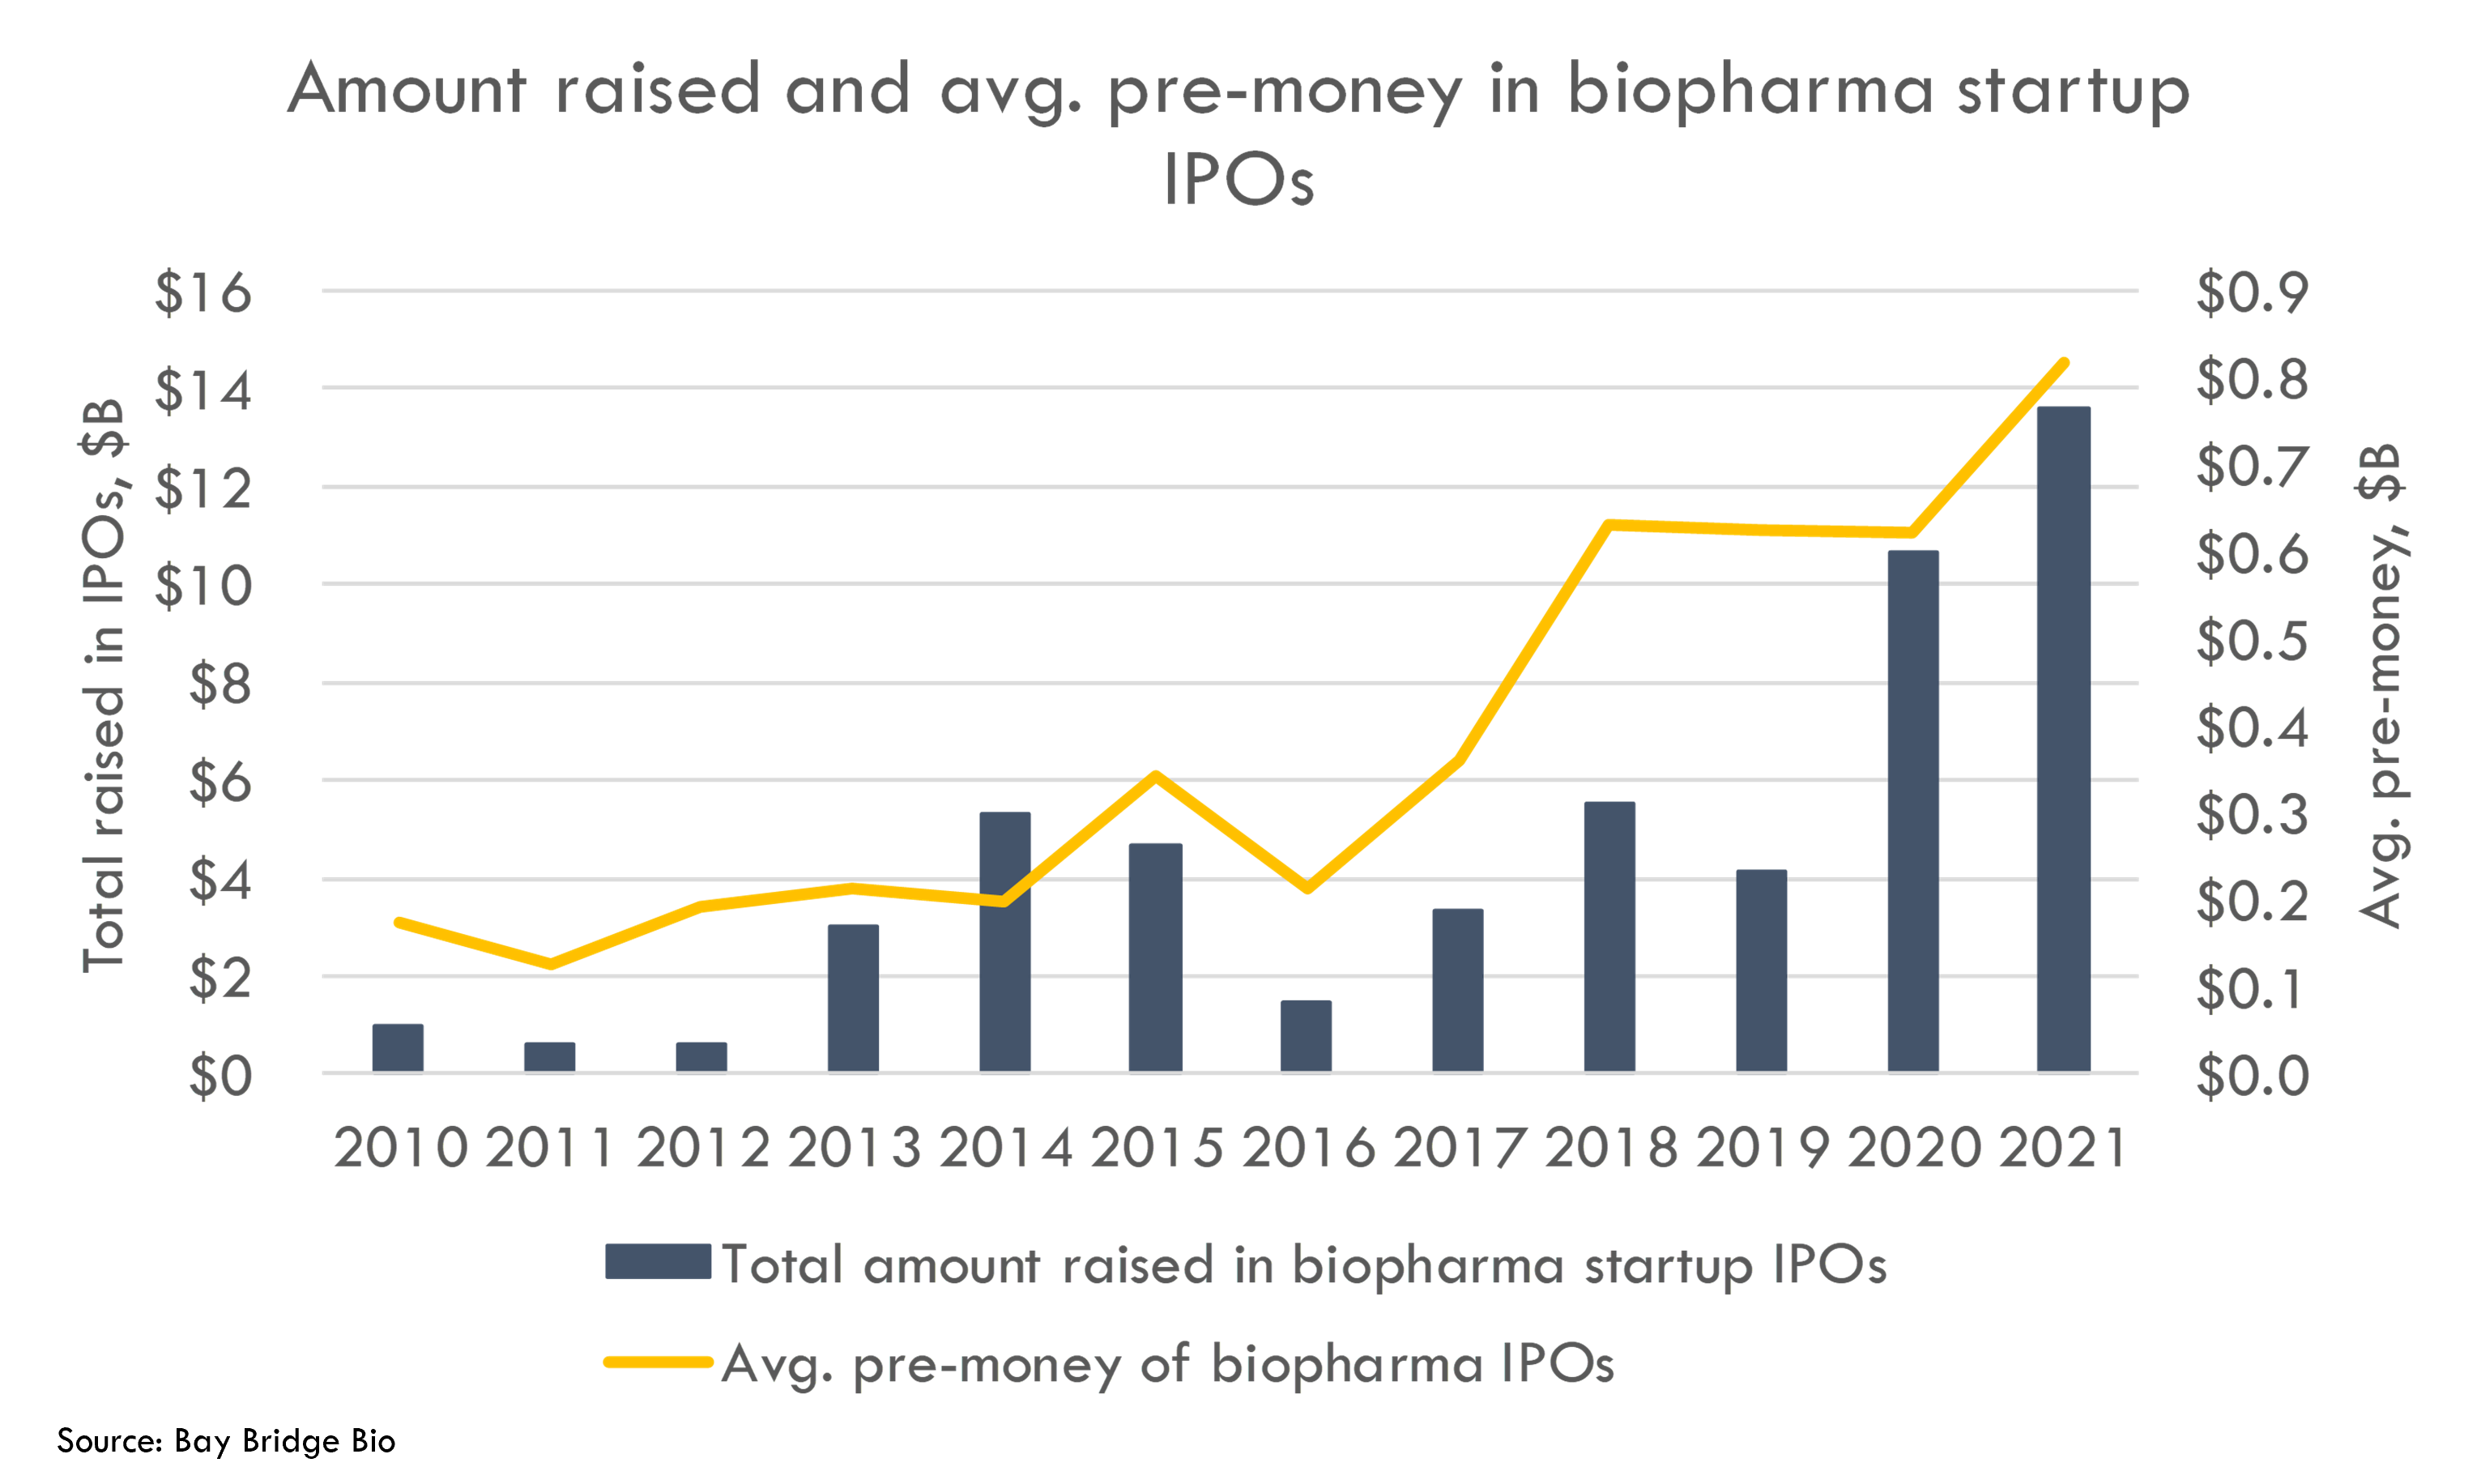
While IPO valuations did not rise too rapidly in the first phase of the IPO boom, the second phase of the boom was marked by climbing IPO valuations, culminating in the COVID bubble.
The sharp increase in IPO valuations was driven by an increase in demand for biotech exposure from large generalist investors and a muted supply of IPO-ready companies.
Supply of IPO-ready companies had not caught up to demand because the IPO pipeline dried up after the 2015 bubble popped. When demand for investing in IPOs increased, it took time for the "IPO supply chain" to ramp back up -- venture-funded startups must “age” for several years before being IPO-ready, so there is a lag of a couple years between IPO demand changing and IPO supply responding to the change in demand.
Crossover investors acted as middlemen to fill this supply-demand imbalance, and they were handsomely rewarded for this work (as shown by their increase in AUM -- and fees). With a shortage of IPO-ready companies, these crossover investors played the role of “pickers” of which companies were IPO-ready. In the face of limited supply of companies and increasing demand for investment, these crossover investors widened their investment criteria and invested in increasingly risky companies. We can see the change in risk tolerance of the IPO market by looking at the risk tolerance 3 of IPOs over time:
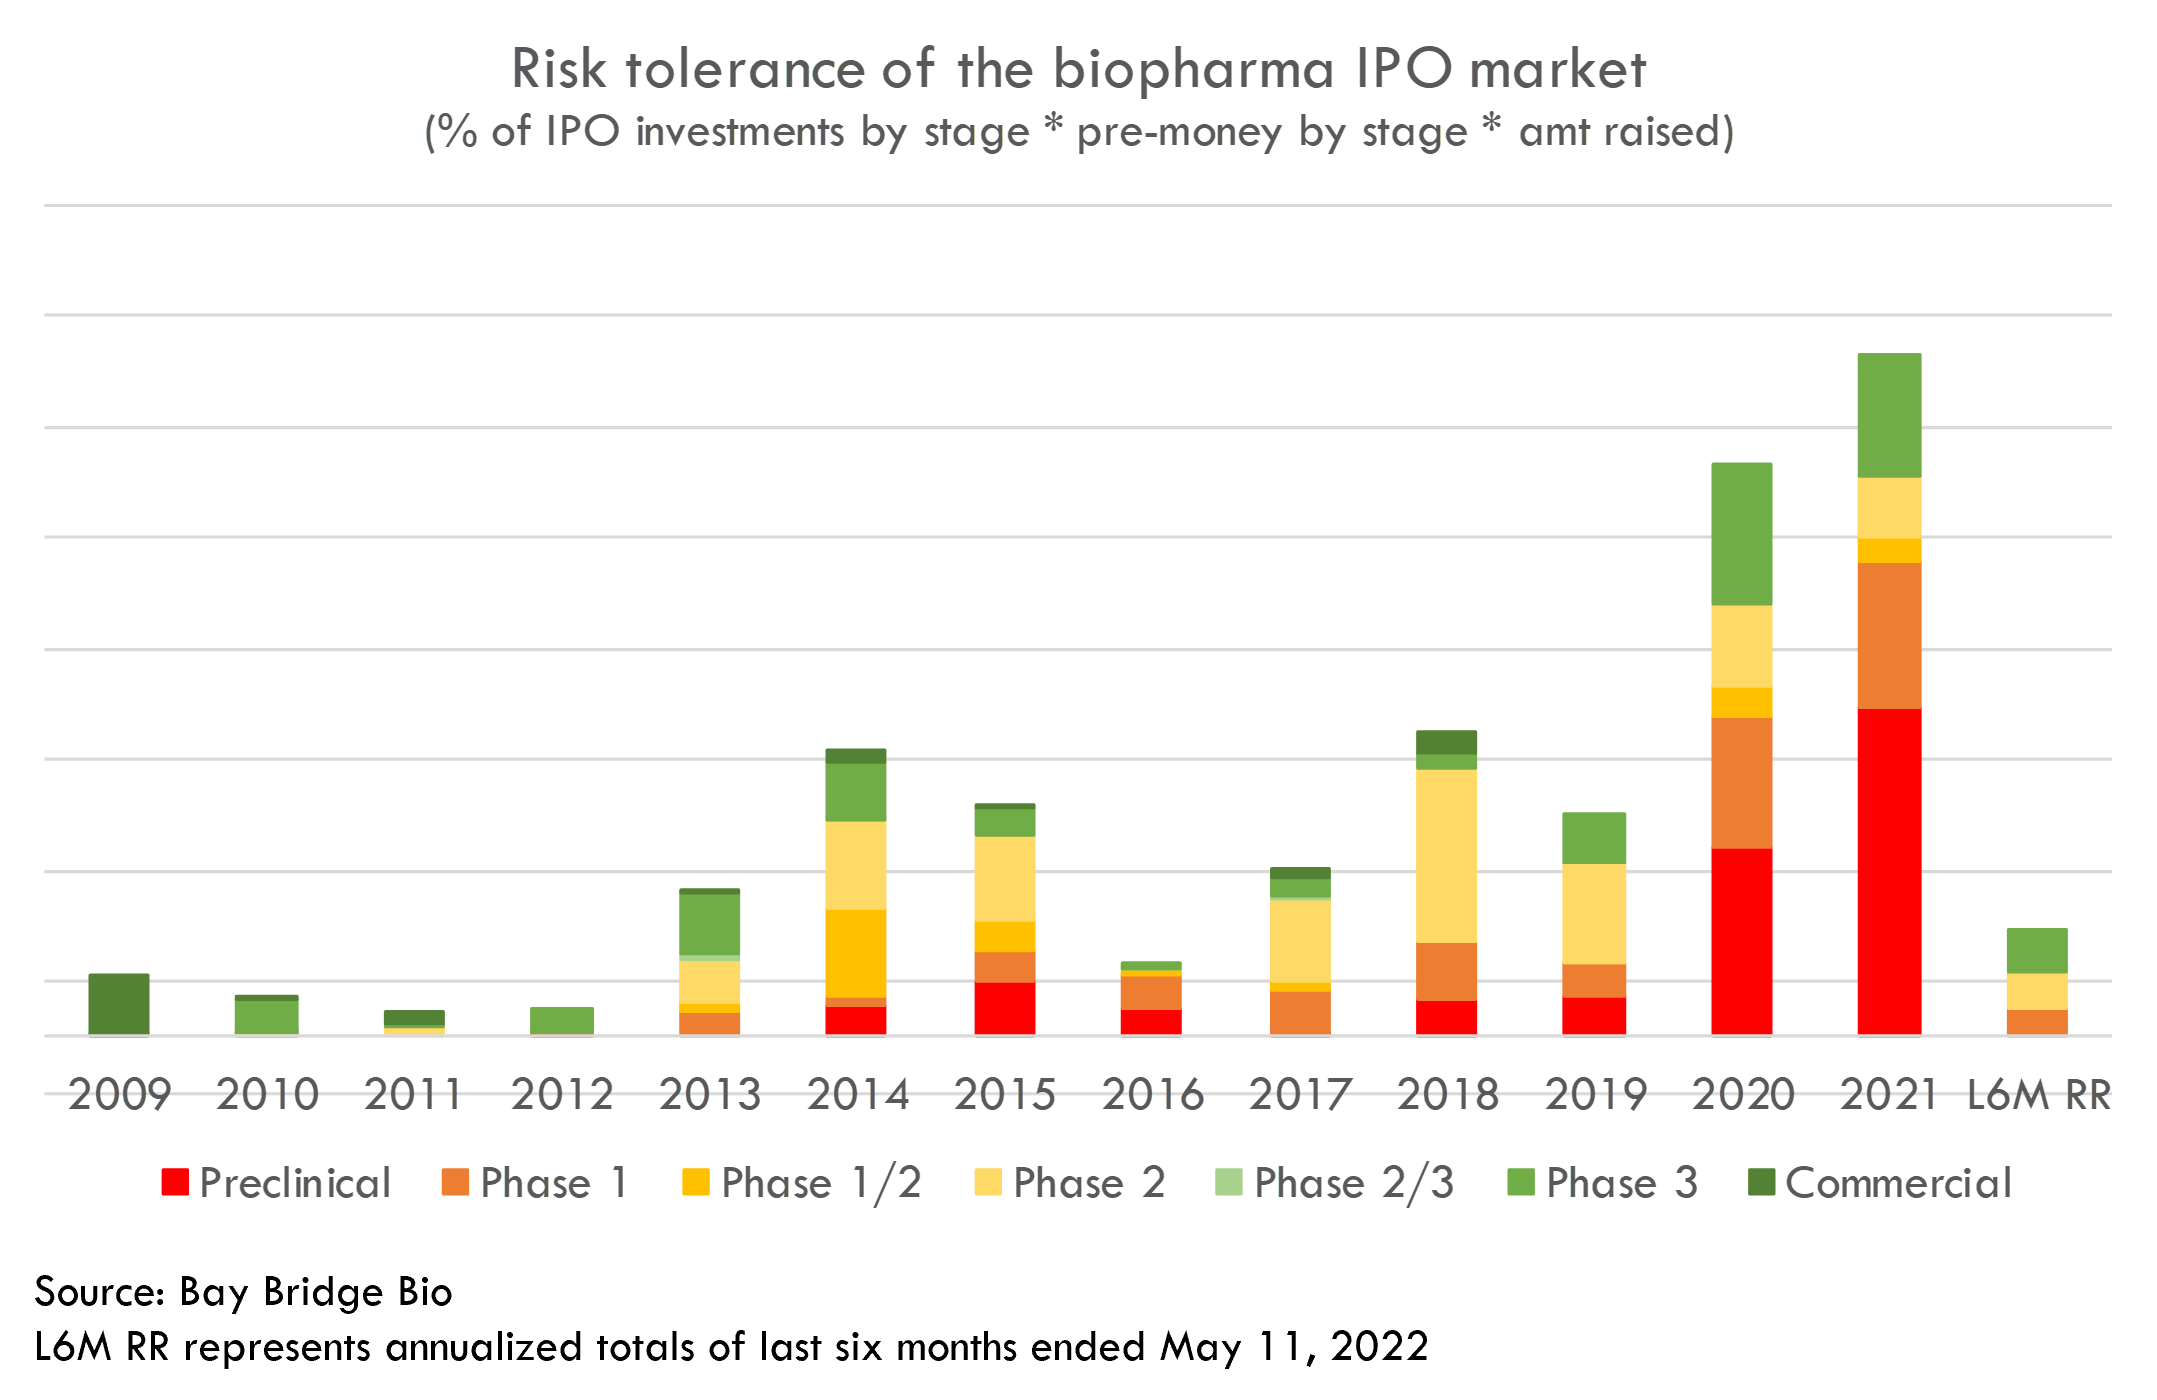
Ultimately, the Fed's aggressive stimulus in response to COVID led demand for all risk assets -- including biotech IPOs -- to skyrocket. Crossover investors opened the floodgates to meet this demand, and companies that were previously too risky for public investors now went public at rich valuations.
The crash
But just as quickly as COVID lifted valuations, valuations crashed. Crossover investors’ public 13F equity portfolios have decreased nearly back to their pre-COVID levels. Some of these funds have lost 60-70% of their peak 13F value.
The crash has been hardest on newly public biotech stocks. Crossover investors have more exposure to these stocks than do other public equity investors. Thus these funds’ public portfolios have taken a big hit.
However, these funds’ private portfolios are in many cases larger than their public portfolios. Private positions are not marked-to-market in the way that public portfolios are, so private investments are slower to recognize losses. Unless there is a recovery, the value of private portfolios will begin to deteriorate as well.
The current market environment is certainly tough on crossover investors (all investors, really). But because these investors play a crucial role in funding the world's biomedical R&D, there is always a need for them. Striking a balance between risk tolerance and discipline will be key towards ensuring that funding for biomedical R&D is sustainable.
The easiest way to build DCF models
Build robust biotech valuation models in the browser. Then download a fully built excel model, customized with your inputs.
1 Assets reported on SEC Form 13F include long positions in exchange-traded public equities, convertible notes, and options. They do not include private equity investments, short positions in public equities, or other securities.
2 The top 10 investors listed here represent those who did the most new Series B investments from 2018-Q1 2022. The list excludes large generalist asset managers Citadel / Surveyor, Fidelity, Janus Henderson, Invus, Wellington and Viking Global as biotech is just a fraction of their AUM. It also excludes GV and Alexandria Venture Investments, as these firms do not maintain large public equity portfolios.
3 This is calculated by multiplying the % of IPOs in each development stage by the average pre-money valuation of IPOs at each stage, and then adjusting that figure by the year's overall IPO volume. This metric may understate risk tolerance because we don't quantify the difference in risk between companies of different stages (we just highlight different stages in different colors).