Expected returns for biotech venture investments
July 2021, Carter and Richard Murphey
Venture capital investment into biopharma startups is at record levels. As more investors compete to invest in the best companies, valuations have been increasing. Is this increase in valuation justified, or is the market overvalued? What are the best investment strategies in the current market? What if the market changes?
This is part of a series of articles exploring these topics. Some will be posted publicly, others we be available exclusively to our clients. We are still finalizing future topics in this series, but potential topics include:
- Analysis of biotech startup returns -- magnitude, distribution and drivers of returns
- Analysis of biotech venture fund returns
- Analysis of current vs. historical fundamental valuations of biotech companies
- Analysis of IPO market robustness to changing macroeconomic conditions
- Analysis of “tech-bio” vs “biotech” fund strategies and returns
If there are any topics you’d be interested in us exploring, let us know here.
Expected value of biotech VC investments
In this post, we examine the expected cash-on-cash returns of biotech venture investments using data from over $75B worth of biotech VC deals, $23B in IPO proceeds, and $150B in total M&A consideration since 2018. We also explore what drives these returns.
This analysis is a market-driven, rather than fundamental, approach to valuation: we value companies based on what investors and acquirors are willing to pay, rather than on the future cash flows that companies are likely to produce. In a subsequent post, we will examine current vs. historical trends in fundamental valuations. This post was written in June 2021, and this analysis reflects a "status quo" market scenario -- this analysis does not cover scenarios of significant upside / downside to the current market.
Unless otherwise noted, the data comes from the Bay Bridge Bio investor database. In this post, I use the terms “biotech” and “biopharma” interchangeably to refer to companies that develop FDA-regulated prescription medicines. This analysis does not cover tools, diagnostics, or med devices -- just startups developing FDA-regulated prescription drugs.
Expected value: a quick intro
In this post, we will focus on the expected value of biotech investments.
The expected value of an investment is the sum of each possible outcome of an investment times the probability of that outcome occurring.
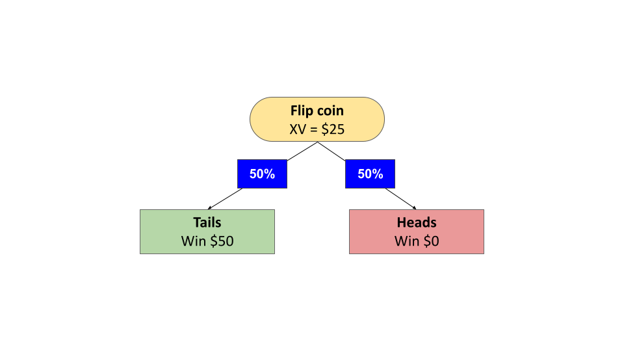
As a simple example, say someone offers you a deal: you flip a coin, and if it lands on tails, you win $50. But you have to pay $30 to play the game.
You’d probably decline this deal: the expected value of the coin toss ($25 = 50% * $50 + 50% * 0) is less than the price of playing. Because the game costs $30 to play, you’re expected to lose $5 if you play the game. If the cost to play is less than $25, however, it would make more sense to play the game.
Our analysis models biopharma venture investing as a more complex version of this coin-toss game: a company offers to pay you (an investor) a large amount of money if it is successful, in exchange for you investing money upfront. Do you take the bet?
To answer that question, we need to know three basic things: how likely we are to win, how much we get if we win, and how much it costs to play the game.
Analyzing biotech startup “fates”
First, we calculate how likely we are to “win” if we invest in a biotech startup. We do this by analyzing the “fates” of companies based on round of investment (Series A through IPO).
In the coin toss example above, we would model the “fates” of the coin toss like this (XV = expected value):
We can use a similar process to model the “fates” of a biotech startup. For each round of investment, we calculate the percentage of companies progressing into subsequent “states”:
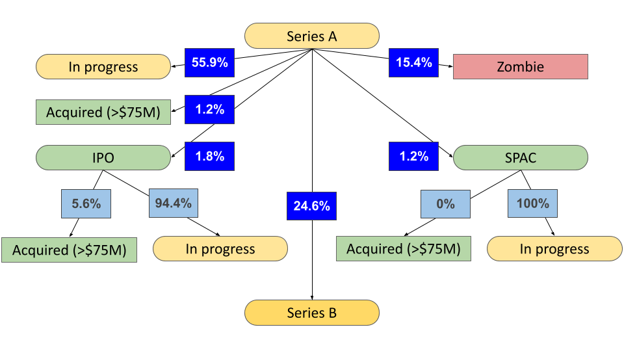
Square rectangles represent “terminal states”, rounded rectangles represent “interim states”; red represent outcomes where investors lose money, green are outcomes where investors make money
In our model, after raising a Series A, a company can progress into the following states:
- Raise a Series B
- Go public via an IPO
- Go public via a SPAC
- Be acquired by a larger company
- Become a “zombie” -- ie not able to raise additional capital within a specified time period (small acquisitions are also included in this category). For this analysis, we have defined "zombies" as companies that have not raised additional capital, done a partnership, gone public, or been acquired within two years of their last announced funding.
- Or remain in the same state (ie “in progress”) if the company has raised money recently and not yet had time to progress to a new state
We create a similar tree for Series B, C, D, E and F investments. We then calculate the expected value of each state using data from $250B in biopharma venture investments and exits since January 2018. For more detail on the methodology, see the "Methodology" section below.
For example, we calculate the value of the “large acquisition” state using the average and median values of announced acquisitions of VC-backed biopharma companies since January 2018. We then calculate the value of Series A investors’ stake in those companies by multiplying the value at acquisition by the average / median percent ownership of Series A investors at time of acquisition.
For companies that go public, we calculate the expected value using the market cap one year post-IPO (or the current market cap if the IPO was less than a year ago). As this is a somewhat arbitrary assumption (VCs generally hold their stock for at least a year or two post-IPO), we also show MOIC calculated using stock prices two years post-IPO.
Biotech startup fates
First, we calculate the “state transitions” for each investment round. Below are the state transitions for companies that raised Series A-C rounds since January 2018:
State transitions of companies funded in 2018-Q1 2021
As we can see, few Series A companies exit without raising subsequent capital. However, the IPO market is open to later-stage companies. M&A activity is relatively uncommon.
There are also many "in progress" companies, as the pace of investment has been accelerating. "In-progress" are defined as companies that have not exited, but are not zombies, as they have raised money recently (ie within the two-year "zombie threshold"). To model the fates of these "in-progress" companies, we apply the state transitions from a subset of companies that raised money in 2018. Because 2018 is more than two years ago, and our zombie threshold is two years, the fates of these companies will be "resolved" -- they have either done a deal, or are zombies (unless they have done a partnership with a larger pharma company rather than a raise additional venture capital to fund their work -- we classify these companies as "in-progress", which is why there is still a small percentage of "in-progress" companies in the below table).
Below are the fates of the sample of biopharma startups that raised VC in 2018:
State transitions of companies funded in 2018
Why do we include these "in-progress" companies in the analysis at all? For two reasons: 1) it increases the sample size of companies we can analyze and 2) it provides a more recent picture of the biotech startup ecosystem. Given how quickly the biotech funding market is evolving, an up-to-date analysis is important.
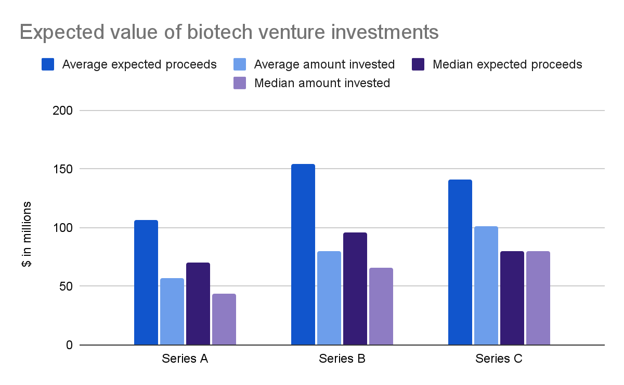
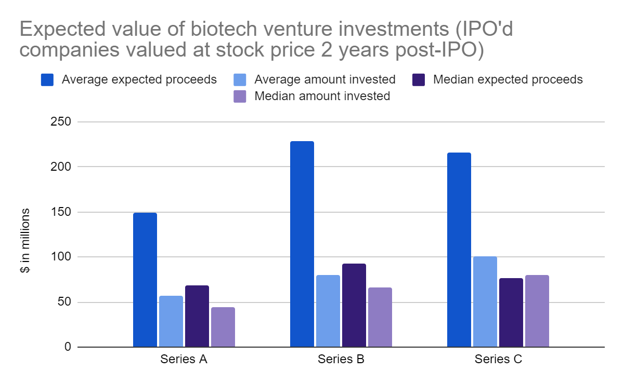
Expected values of Series A, B and C investments
Above, we show the average and median expected values for Series A, B and C investments compared to the average and median amount invested in each round over the same time period. These are undiscounted values.
Below, we show the expected MOIC for each Series:
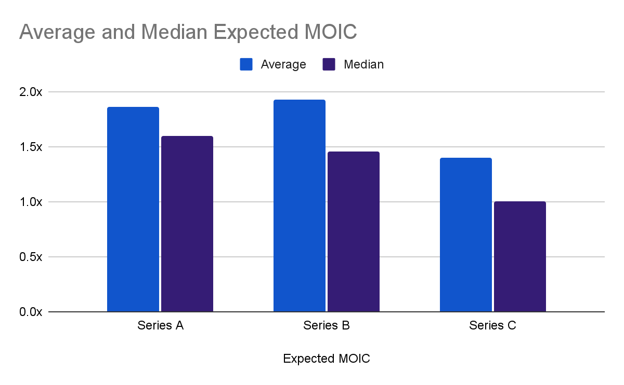
Series A and B investing generate expected MOICs of 1.5-2.0x. According to Cambridge Associates data, these expected returns are generally in line with the pooled average and median cash-on-cash returns data for venture funds raised since 1998 (although the CA data is net of fees, and the MOICs we show here are before fees). Based on our analysis, biotech venture investing broadly is not expected to outperform historical VC returns. It is possible to get outlier returns from biotech venture investing, but doing so requires selection of the right funds (of course, this conclusion should be taken as just one piece of evidence -- this is not a definitive analysis and is subject to the limitations discussed elsewhere in the post).
As we mentioned above, this analysis calculates expected proceeds using the stock price of IPO'd companies one year post-IPO. As this assumption is somewhat arbitrary, we also calculated expected proceeds using stock prices two years post-IPO. Results for the expected proceeds and expected MOIC are shown below. With the exception of these two below charts, the rest of the analysis uses the one year post-IPO methodology.
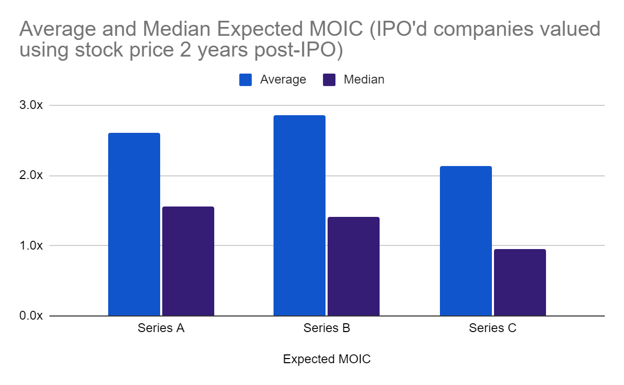
The average MOICs are much higher using the two-year methodology. On the other hand, median expected MOICs are the same, suggesting that there were a few outperforming outlier investments. This is, in fact, the case: about half of the increase in average MOIC comes from the increase in BioNTech's stock during COVID (Moderna's COVID stock appreciation is not included, as the two year anniversary of Moderna's IPO is December 2020, just before COVID).
While these expected MOICs are not particularly high, the IRRs for Series B investments are likely very strong (we did not calculate IRR in this analysis, but back-of-the-envelope IRRs for Series B investments are 30-40%). These returns are driven largely by IPOs (as discussed below), and these days companies generally IPO 3-4 years after Series A and just over 6 months after the B round. Thus, IRRs will be quite high even at these MOICs.
In addition to looking at the overall level of returns, it is also important to examine the distribution of returns. We will look at this in a subsequent post.
Defensible clinical trial cost estimates
Get transparent cost estimates for any trial in minutes. Input an NCT ID or upload a protocol, then see a full cost analysis report.
Drivers of expected MOIC
What drives these returns? Lots of M&A? High IPO valuations? A large percentage of companies going public?
By analyzing the drivers of returns, we can begin to understand how sensitive returns might be to changes in market conditions. For example, if returns are driven primarily by M&A, we can analyze the pipelines of big pharma companies and the funding they have available for acquisitions to assess whether M&A will continue to be strong.
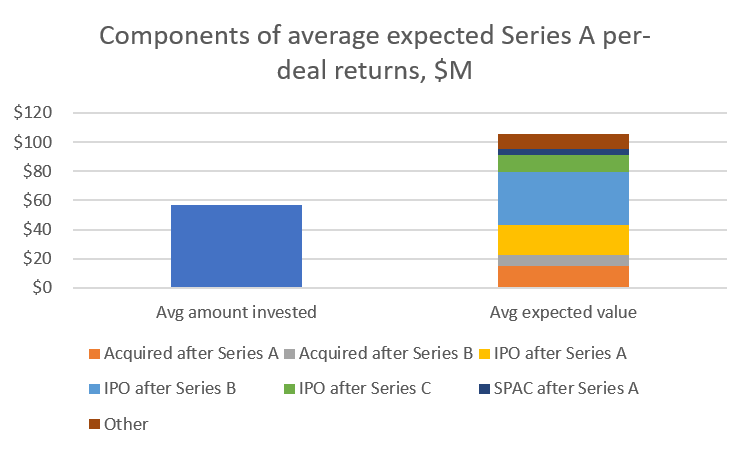
Above, we see the components of the expected returns of Series A investments. The left bar shows the average amount invested in Series A rounds. The right bar shows the components of the expected value of the investment.
For Series A investments, we see that the largest driver of expected returns are IPOs after raising a subsequent Series B round. The prototypical biotech startup is seeded by a prominent early-stage venture firm who will lead the Series A, and then a crossover investor will lead the Series B and support the IPO..
IPOs directly after raising a Series A round also make up a large component of returns. While the percentage of companies that go public after raising a Series A round is lower than the percent that go public after raising a Series B round, Series A investors own more of the company at IPO if the company skips the Series B round and goes straight to the public markets.
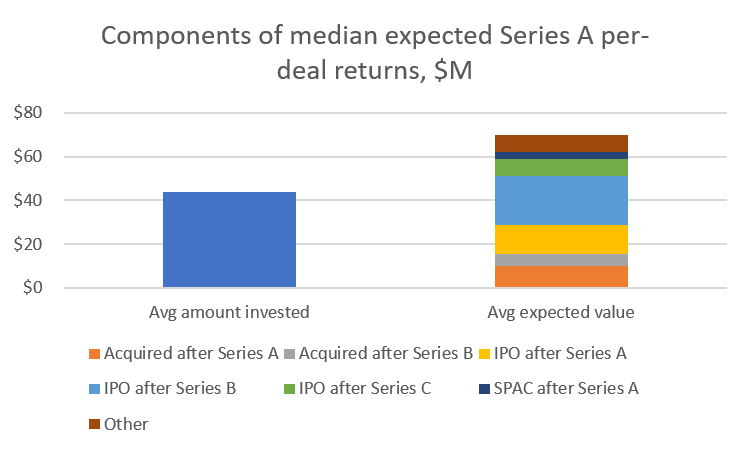
Next we look at the components of median returns, which are similar to those of the average returns.
Moving on to the drivers of Series B returns:
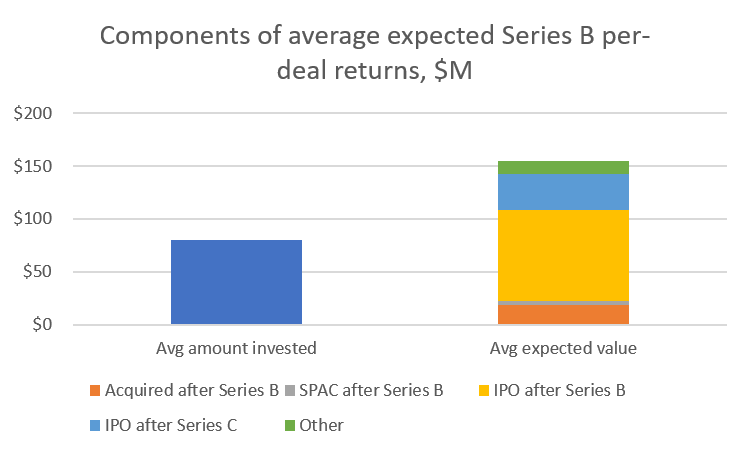
Series B returns are all about quick IPOs. Crossover investors, who are the most active Series B investors, have become incredibly effective at finding “IPOable” companies and shepherding them onto the public markets. In return for this, these investors get a nice step-up and a quick flip to IPO.
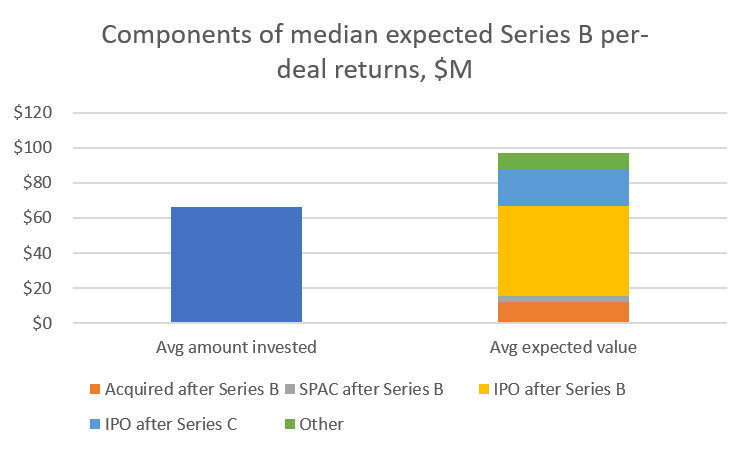
The composition of median returns is similar, but the level of cash-on-cash returns is lower, suggesting that returns of the Series B asset class are driven more by a few outliers than Series A returns.
Below we show the components of the average and median Series C returns.
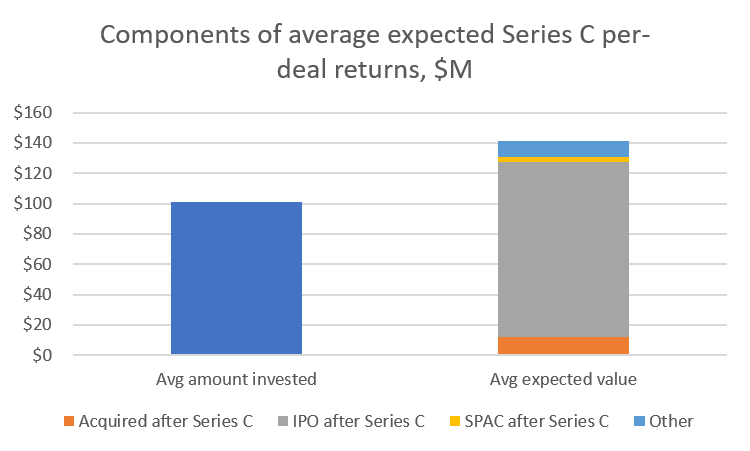
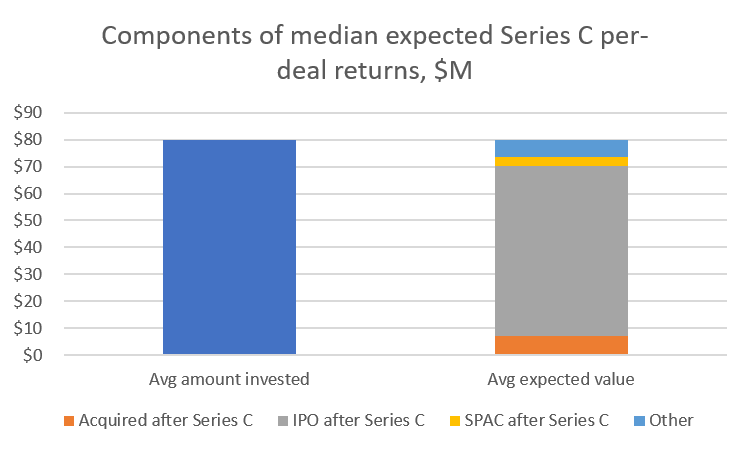
The median Series C return is 1.0x. This is in part because companies that IPO after Series C do so at similar valuations to companies that IPO after Series B, but Series C investors invest at a higher valuation. And while the percentage of Series C investments that IPO is higher than the percentage of Series B investments that IPO, the difference is not large enough to make up for the higher valuations that Series C investors must pay. Further, Series B companies have more margin of safety than Series C companies -- if a company doesn't go public after a Series B round, they can raise a Series C and still often go public. However, there are fewer instances of companies going public after Series D.
Discussion
What are the takeaways from this? As this is an exploratory analysis, rather than drawing firm conclusions, we will identify important areas for further research.
One observation is that expected returns are decent, but not great by historical standards. This is somewhat surprising given the strength of the public markets and IPO market for biotech. There are certainly biotech funds that are doing very well.
While we are still analyzing the data, it appears that biotech funds can be broken down into two groups: the experienced specialists funds that do a lot of investments and perform exceptionally well, and a long tail of funds that are not as active or successful. It doesn't seem to pay to dabble in biotech -- the funds that are not plugged into the "IPO machine" generate very few exits, while the funds that know what kinds of companies are IPO-able and have relationships with downstream investors do very well.
Another noteworthy, yet not surprising, observation is that returns are highly reliant on the IPO market. This isn’t news to anyone in the industry, but quantifying the extent to which the IPO market drives returns has important implications for fund managers, LPs, and startup executives.
A material correction in the IPO market, or public equity markets generally, poses a major risk to returns. While returns would likely be supported to some extent in a downside scenario by M&A (assuming big pharma becomes more acquisitive as target company valuations decrease), expected returns don't have a lot of room to fall before they become low relative to historical VC returns. If fundamental valuations are high compared to historical levels, and expected returns are decent but not much higher than average, then the risk / reward of the sector generally may be skewed to the downside.
Opportunity in blue-chip biotech and emerging "tech-bio"
Specific biotech funds are delivering outlier returns, and specific strategies within biotech venture may deliver significant outperformance. Which funds and strategies are most promising will be the subject of future research. Our working hypothesis is that, barring a broad market downturn, investing with the best-performing Series A and crossover funds will continue to generate strong returns, and that an emerging area of opportunity is in the Series A and downstream funding markets for "tech-bio" companies.
"Tech-bio” refers to a new class of biotech startups and investors that have become an increasingly large part of the ecosystem over the last few years. These startups are often founded by young scientists (as opposed to the big pharma veterans that run traditional biotech startups) and are funded by software / “tech” VCs that have become interested in biotech.
These tech-bio investors have been very active at the seed stage over the last few years, but until recently they have not written many Series A checks. Thus tech-bio startups that raised money quickly and on good terms for their seed round had to rely on more conservative biotech VCs for their Series A rounds, with valuation resets or changes to management not uncommon.
Over the last 18 months, however, a handful of these more founder-friendly tech-bio funds have become very active in the Series A market, and a longer tail of these funds will lead or follow on a couple of Series A deals per year. It is still unclear how deep this market is, but it seems reasonable to assume that more funds will start doing Series A deals given 1) the experience they have gained writing seed checks, 2) the significant gap between the large supply of attractive tech-bio companies and paucity of tech-bio Series A investors, and 3) the recent IPOs and SPACs of the first wave of tech-bio startups (Recursion, Zymergen, AbCellera, Gingko, 23andme among others).
It will also be interesting to see how downstream funding markets evolve for tech-bio companies. The first generation of tech-bio companies raised later-stage capital from a handful of hedge funds, sovereign wealth funds and other direct-investing LPs, but the market is still quite immature. If Series A tech-bio VCs can cultivate relationships with public equity investors, or seek direct investments in their portfolio companies from LPs, they can establish a strong competitive advantage: a reliable route to the public markets on attractive terms, potentially bypassing the crossover investors that guide traditional biotech startups to IPO.
It is likely that traditional biotech crossover investors become more active in tech-bio and synbio. Some prominent biotech crossovers are indeed participating in early funding rounds for tech-bio companies to learn about the space and gain a foothold for later-stage investment. Traditional biotech crossover investors have been seeking higher returns by moving into earlier-stage investing, leading more Series A deals and even setting up incubators. Rather than competing with the established early-stage biotech VCs for deals, there is a substantial opportunity for biotech crossover investors to figure out how to guide tech-bio companies through IPO (or, increasingly, through SPAC).
Another group that will likely become active in downstream tech-bio funding markets are software-focused growth funds. Seeing the success of their earlier-stage peers who have crossed over from software to biotech, these funds will likely be aggressive in expanding into tech-bio over the coming months. If you are a young scientist looking to break into VC, keep your eye out for these funds -- they will be hiring folks like you to help them evaluate opportunities.
Of course, all of these predictions assume the market stays hot. While it is impossible to predict when a market downturn will occur, it is possible to calculate whether valuations are high compared to historical levels, and to estimate how far valuations can fall in downside scenarios. These topics will be subjects of future analyses.
Methodology
To calculate the percentage of companies that progress into each state, we analyze the “state transitions” of biopharma startups that raised venture capital since January 2018. In this analysis, we look at Series A and later venture rounds (ie we do not analyze angel investments, pre-seed / seed rounds, accelerators, grant-funded companies, etc).
We include all deals in the database from 2018-2020, rather than just focusing on a cohort of companies that raised a given round in the time period. For example, when we calculate Series A expected values, we include all Series B/C/later deals, rather than only Series B/C/later deals for companies that also raised a Series A within the time period. This increases the sample size and provides a more current picture of the market, but means that the expected values in our analysis will differ from the overall realized values achieved by companies during the time period.
To classify companies that have not progressed to a “terminal state” -- ie an exit or going out of business -- we define a “zombie threshold” of 2 years. This threshold is somewhat arbitrary, but most companies raise a new round of capital less than 2 years from their last round, so it seems a reasonable value.
We also define companies that partner with other pharma companies (licensing deals, co-development deals) rather than raising capital as “in progress”, so if a company hasn’t raised money in 3 years, but they’ve done a licensing deal with pharma, we classify them as in progress rather than as a zombie. If the company is acquired by a large pharma company (as opposed to doing a licensing deal where the startup still retains rights to core assets), the company is classified as acquired.
Below we show "fate trees" for Series A-C companies.


The expected value of an investment, given a set of state transitions (which we calculated above), equals the sum of the value of each branch of the tree. We calculate the value of a branch by multiplying the percentage of companies that advance through each branch times the value of the branch. We calculate the expected value of an investment at a given stage, starting with “terminal states”. A terminal state is one where there are no subsequent states.
For example, if 20% of companies are acquired after Series B for an average of $500M, and 80% of companies fail after Series B and return $0 to investors, then the value of the Series B node = 20% * $500M + 80% * 0 = $100M.
We can then use the value of the Series B branch to calculate the value of prior branches. For example, if 5% of companies are acquired after Series A for an average of $200M, 50% of companies fail after Series A, and 45% raise a Series B, then the value of the Series A branch = 5% * $200M + 50% * 0 + 45% * $100M = $55M.
The final step is calculating how much of the expected value is attributable to the round of interest: Series A investors may own $200M of the value of a company that is worth $500M after raising two venture rounds, with Series B investors owning $200M, and the remaining $100M being owned by founders and employees.
We calculate the value of each “fate” as follows:
- Acquired (>$75M): average and median consideration for acquisitions since January 2018 with upfronts of at least $75M; total consideration = upfront consideration + 0.3 * value of biobucks per SRS Acquiom
- Zombie: 20% * average and median post-money valuation of current round (assuming some assets of the company are liquidated to pay off investors, or part of the company is sold)
- IPO: % of companies acquired after IPO * average / median value of acquisitions + % of companies not acquired after IPO * average / median adjusted market cap1 one-year post IPO
- SPAC: similar to IPO branch
- Next venture round: similar to value of current branch (Series F is the latest tree we include, so the Series F tree does not have a Series G node; we calculate the Series F node first then work backwards to Series E, etc)
- In progress: see below
The most difficult branch to value is the “in progress” branch, as the “fates” of these companies are not yet known. To calculate the percentage of “in progress” companies that advance to the next stage, we use data from the cohort of companies that raised money in 2018. These rounds were raised at least 2.5 years ago. As most companies move to their next state or run out of money within 2.5 years of raising funds, very few companies that raised in 2018 should still be “in progress”.
Another note about SPACs: for the purpose of this analysis, we have only included biopharma IPOs and SPACs. We have excluded med device, tools, diagnostics and software companies that do not have their own in-house drug development business. This excludes the following SPACs and IPOs (this is not an exhaustive list of IPOs we've excluded, but these are the most biopharma-adjacent SPACs and IPOs):
- 23andme SPAC
- Gingko Bioworks SPAC
- Nautilus Biotechnology SPAC
- Quantum-Si SPAC
- Science37 SPAC
- Sema4 SPAC
- SomaLogic SPAC
- 10x Genomics IPO
- Twist Bioscience IPO
- Schrodinger IPO
Note that there are many other healthcare SPACs, but the ones listed above are the most biopharma-adjacent: they develop tools, software or services for biopharma companies. 23andme has an in-house therapeutics pipeline, but it is unclear how much of the business is focused on this vs. the consumer genetics business, so I made a judgment call to exclude it.
Defensible clinical trial cost estimates
Get transparent cost estimates for any trial in minutes. Input an NCT ID or upload a protocol, then see a full cost analysis report.
1 Represents IPO post-money * change in share price since IPO. To more accurately reflect value attributable to venture investors, this excludes shares issued in follow-on offerings (for more on this methodology, see here.
You may also like...
Top biotech VCs of 2018 and 2019
Valuing drugs and biotech companies
Venture returns from biopharma IPOs, 2018-Q1 2019
Valuations of biotech startups from Series A to IPO
Did you enjoy this article?
Then consider joining our mailing list. I periodically publish data-driven articles on the biotech startup and VC world.