Diagnosing the problem with biotech R&D
September 6, 2022
Startup investors are good at predicting which drugs will win FDA approval.
But it has proven more difficult to pick which drugs will make money and generate compelling returns on R&D investment.
The good news is that there is a lot of room for improvement. More discipline around 1) evaluation of commercial potential and 2) operating with more capital efficiency could go a long way.
To understand how productive startups are at R&D, we analyzed a cohort of 77 startups that went public from 2009-2013. Because these companies went public so long ago, their stories have mostly unfolded. Thus we can calculate actual revenue and number of drugs receiving FDA approval instead of relying on uncertain projections.
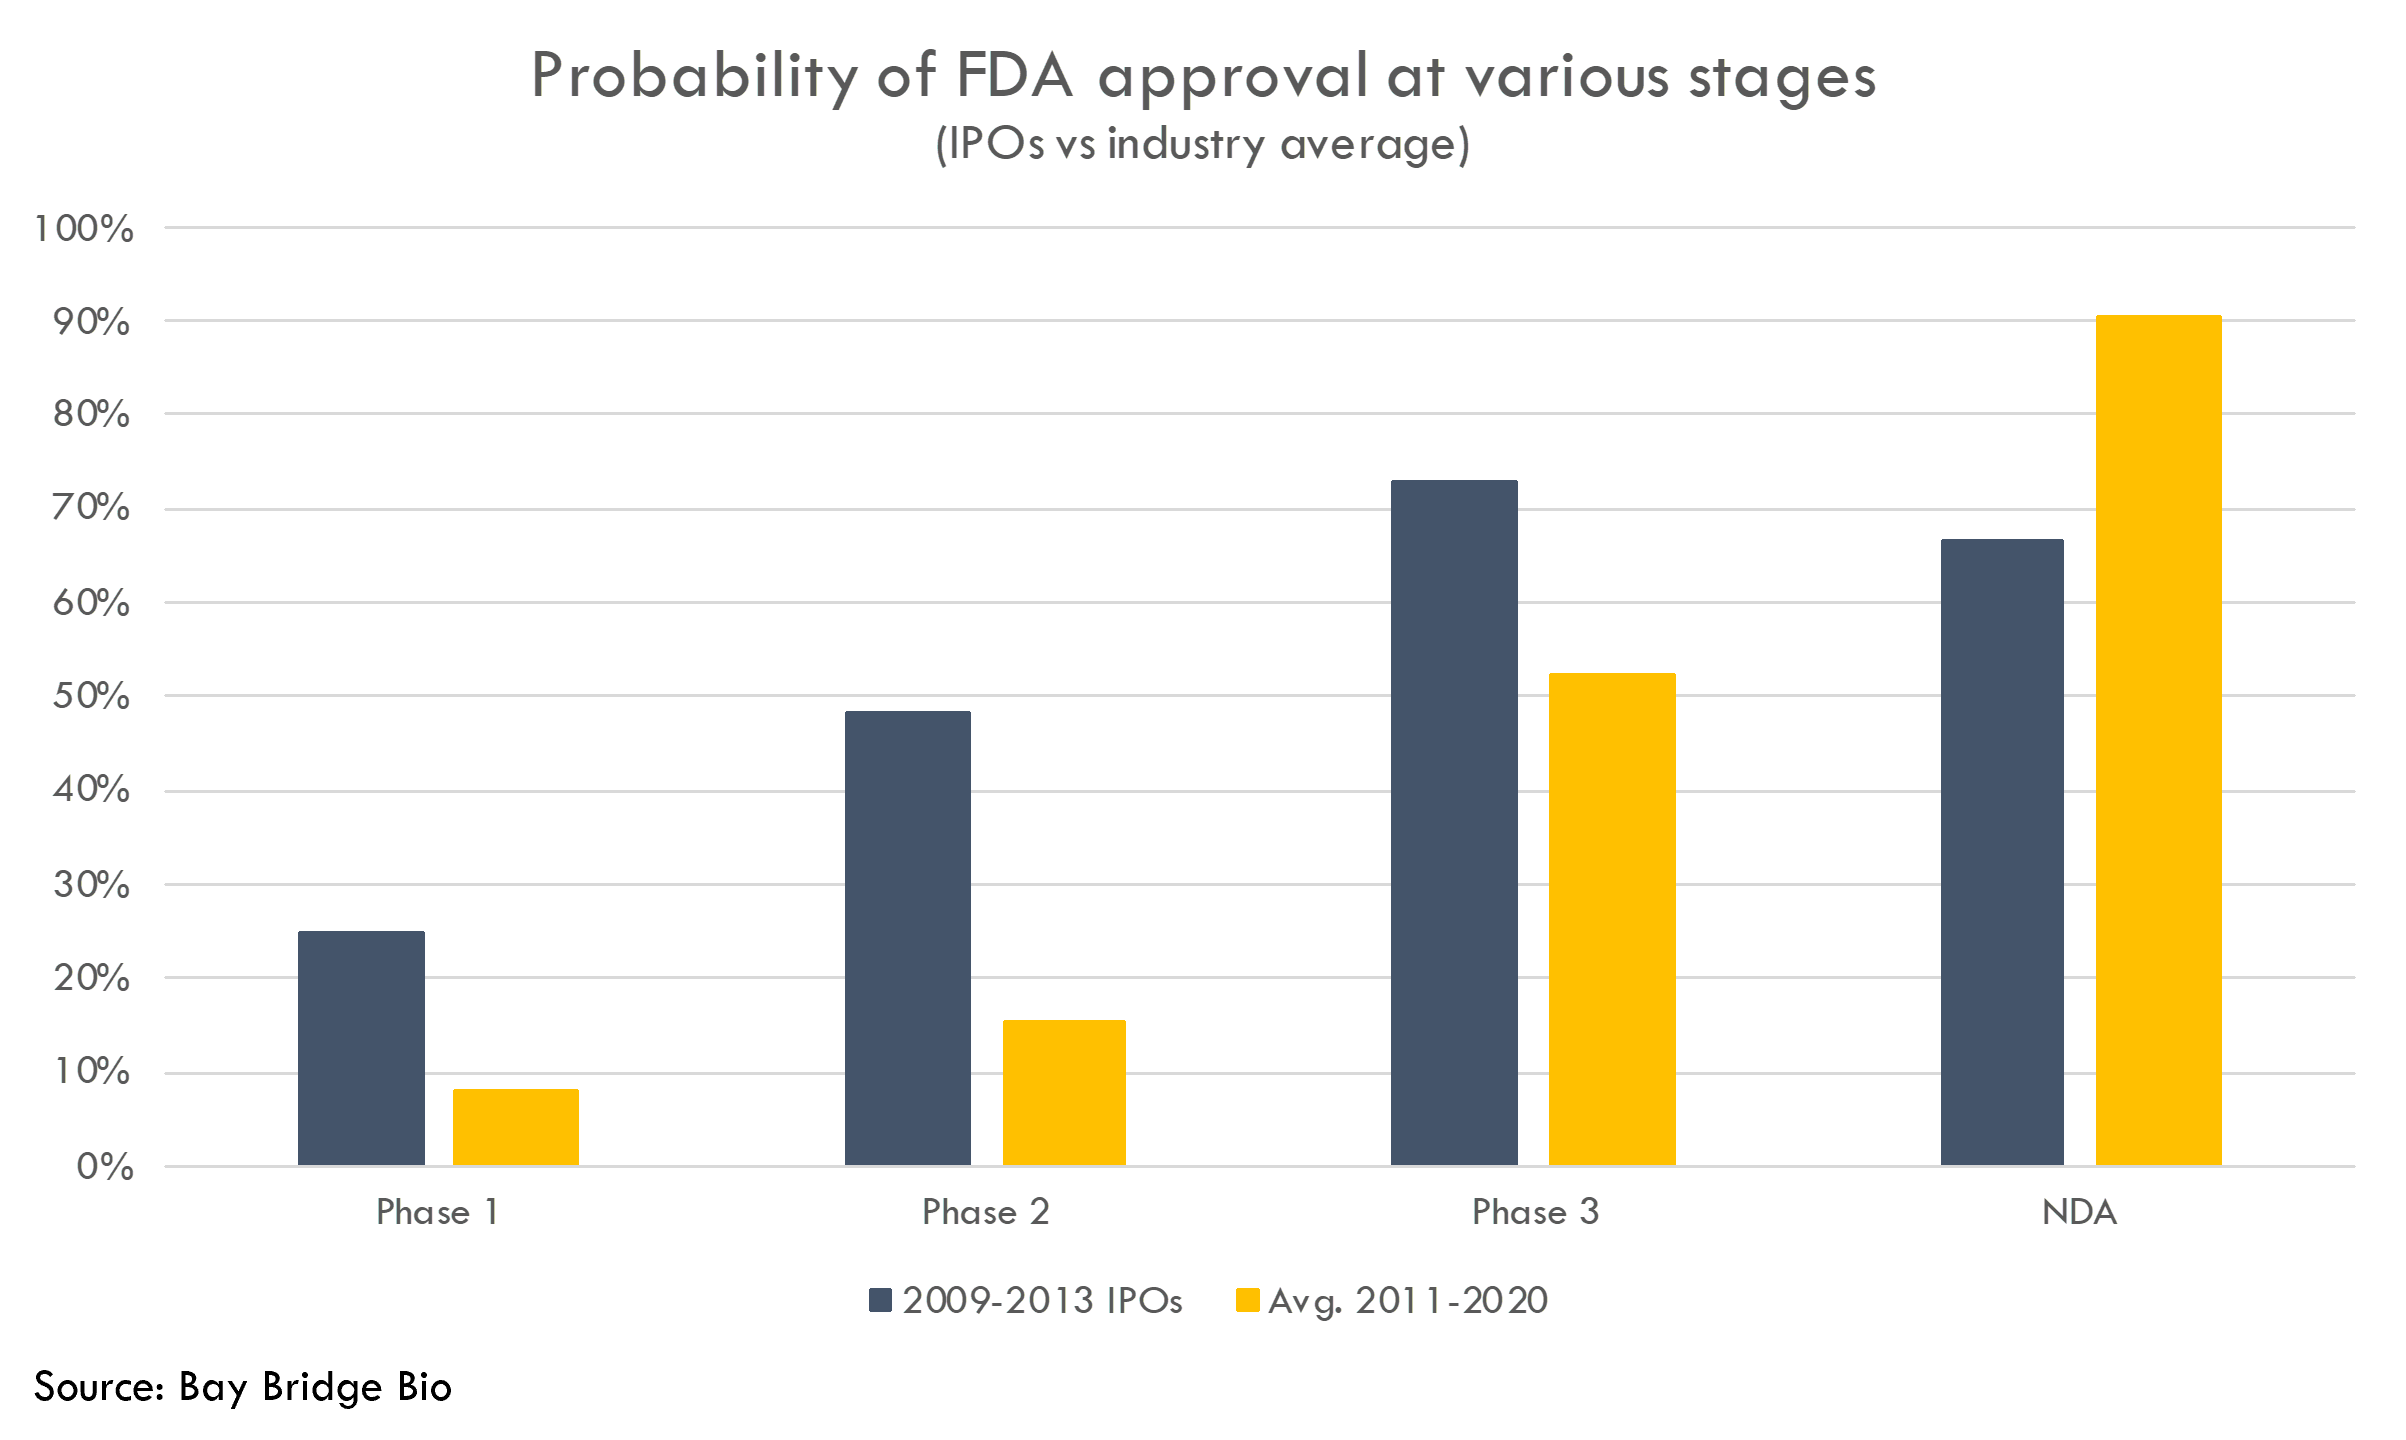
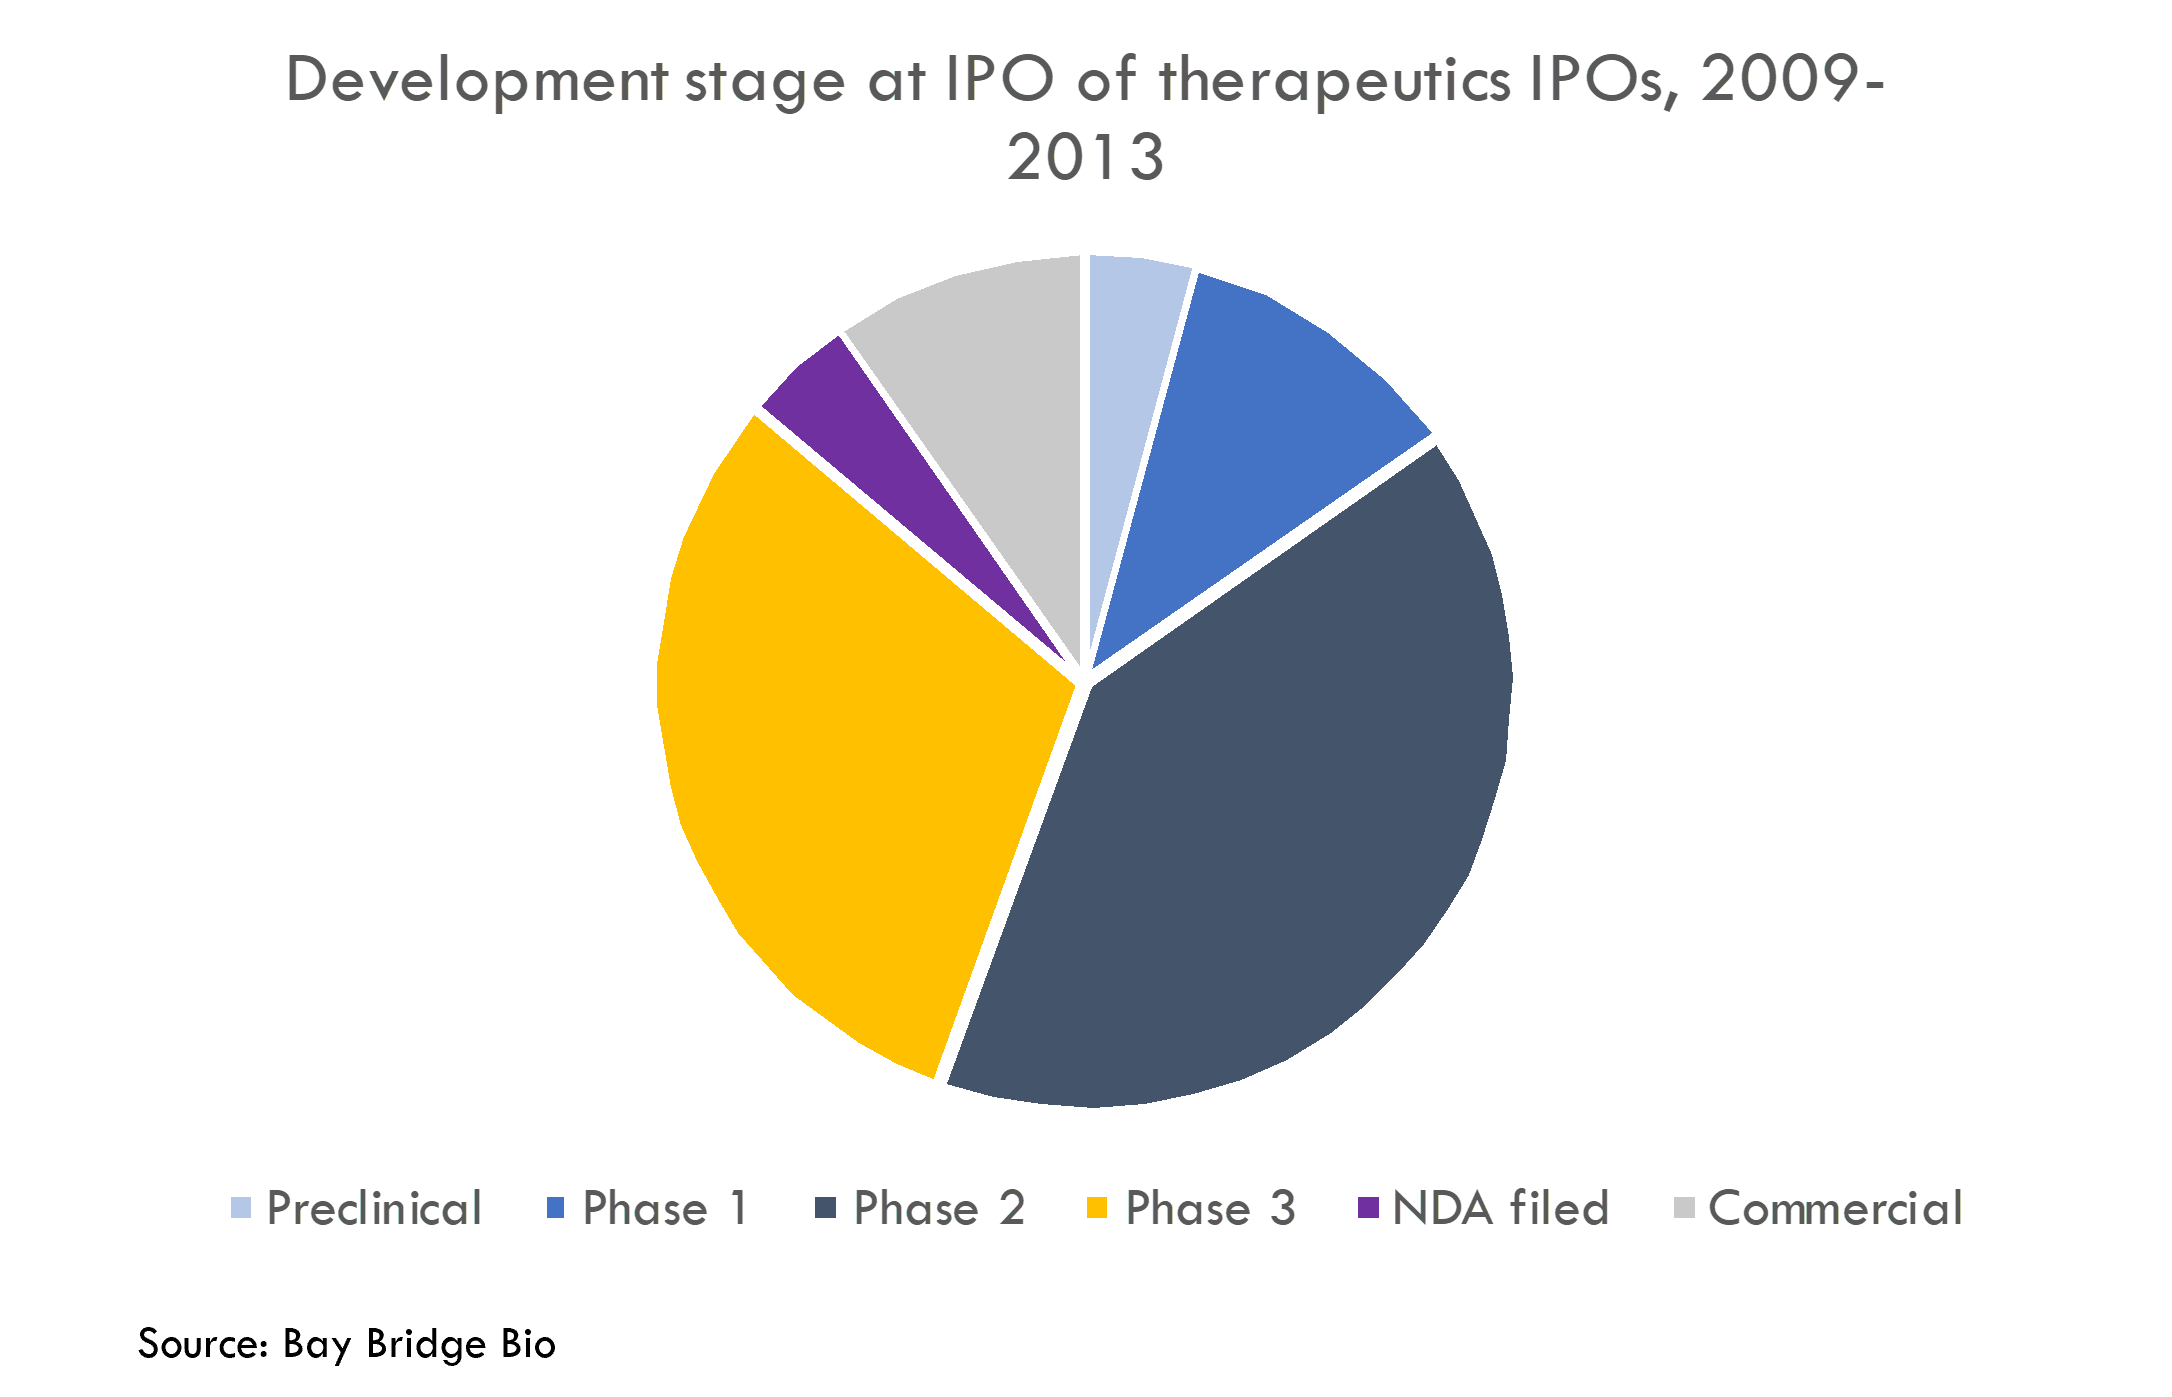
These companies got drugs approved at a higher rate than the rest of the industry. Most of these companies had Phase 2 or Phase 3 assets at IPO, and these products were approved at a higher rate than the industry averages (as reported by BIO, Informa Pharma Intelligence and QLS Advisors in their recent analysis of clinical development success rates from 2011-2020).
But the average product developed by this cohort of startups, once approved by FDA, generated annual revenue of only $174M as of Q4 2022. And the median product generated only $46M annually. If we include all products, not just the approved ones, average revenue is $125M.
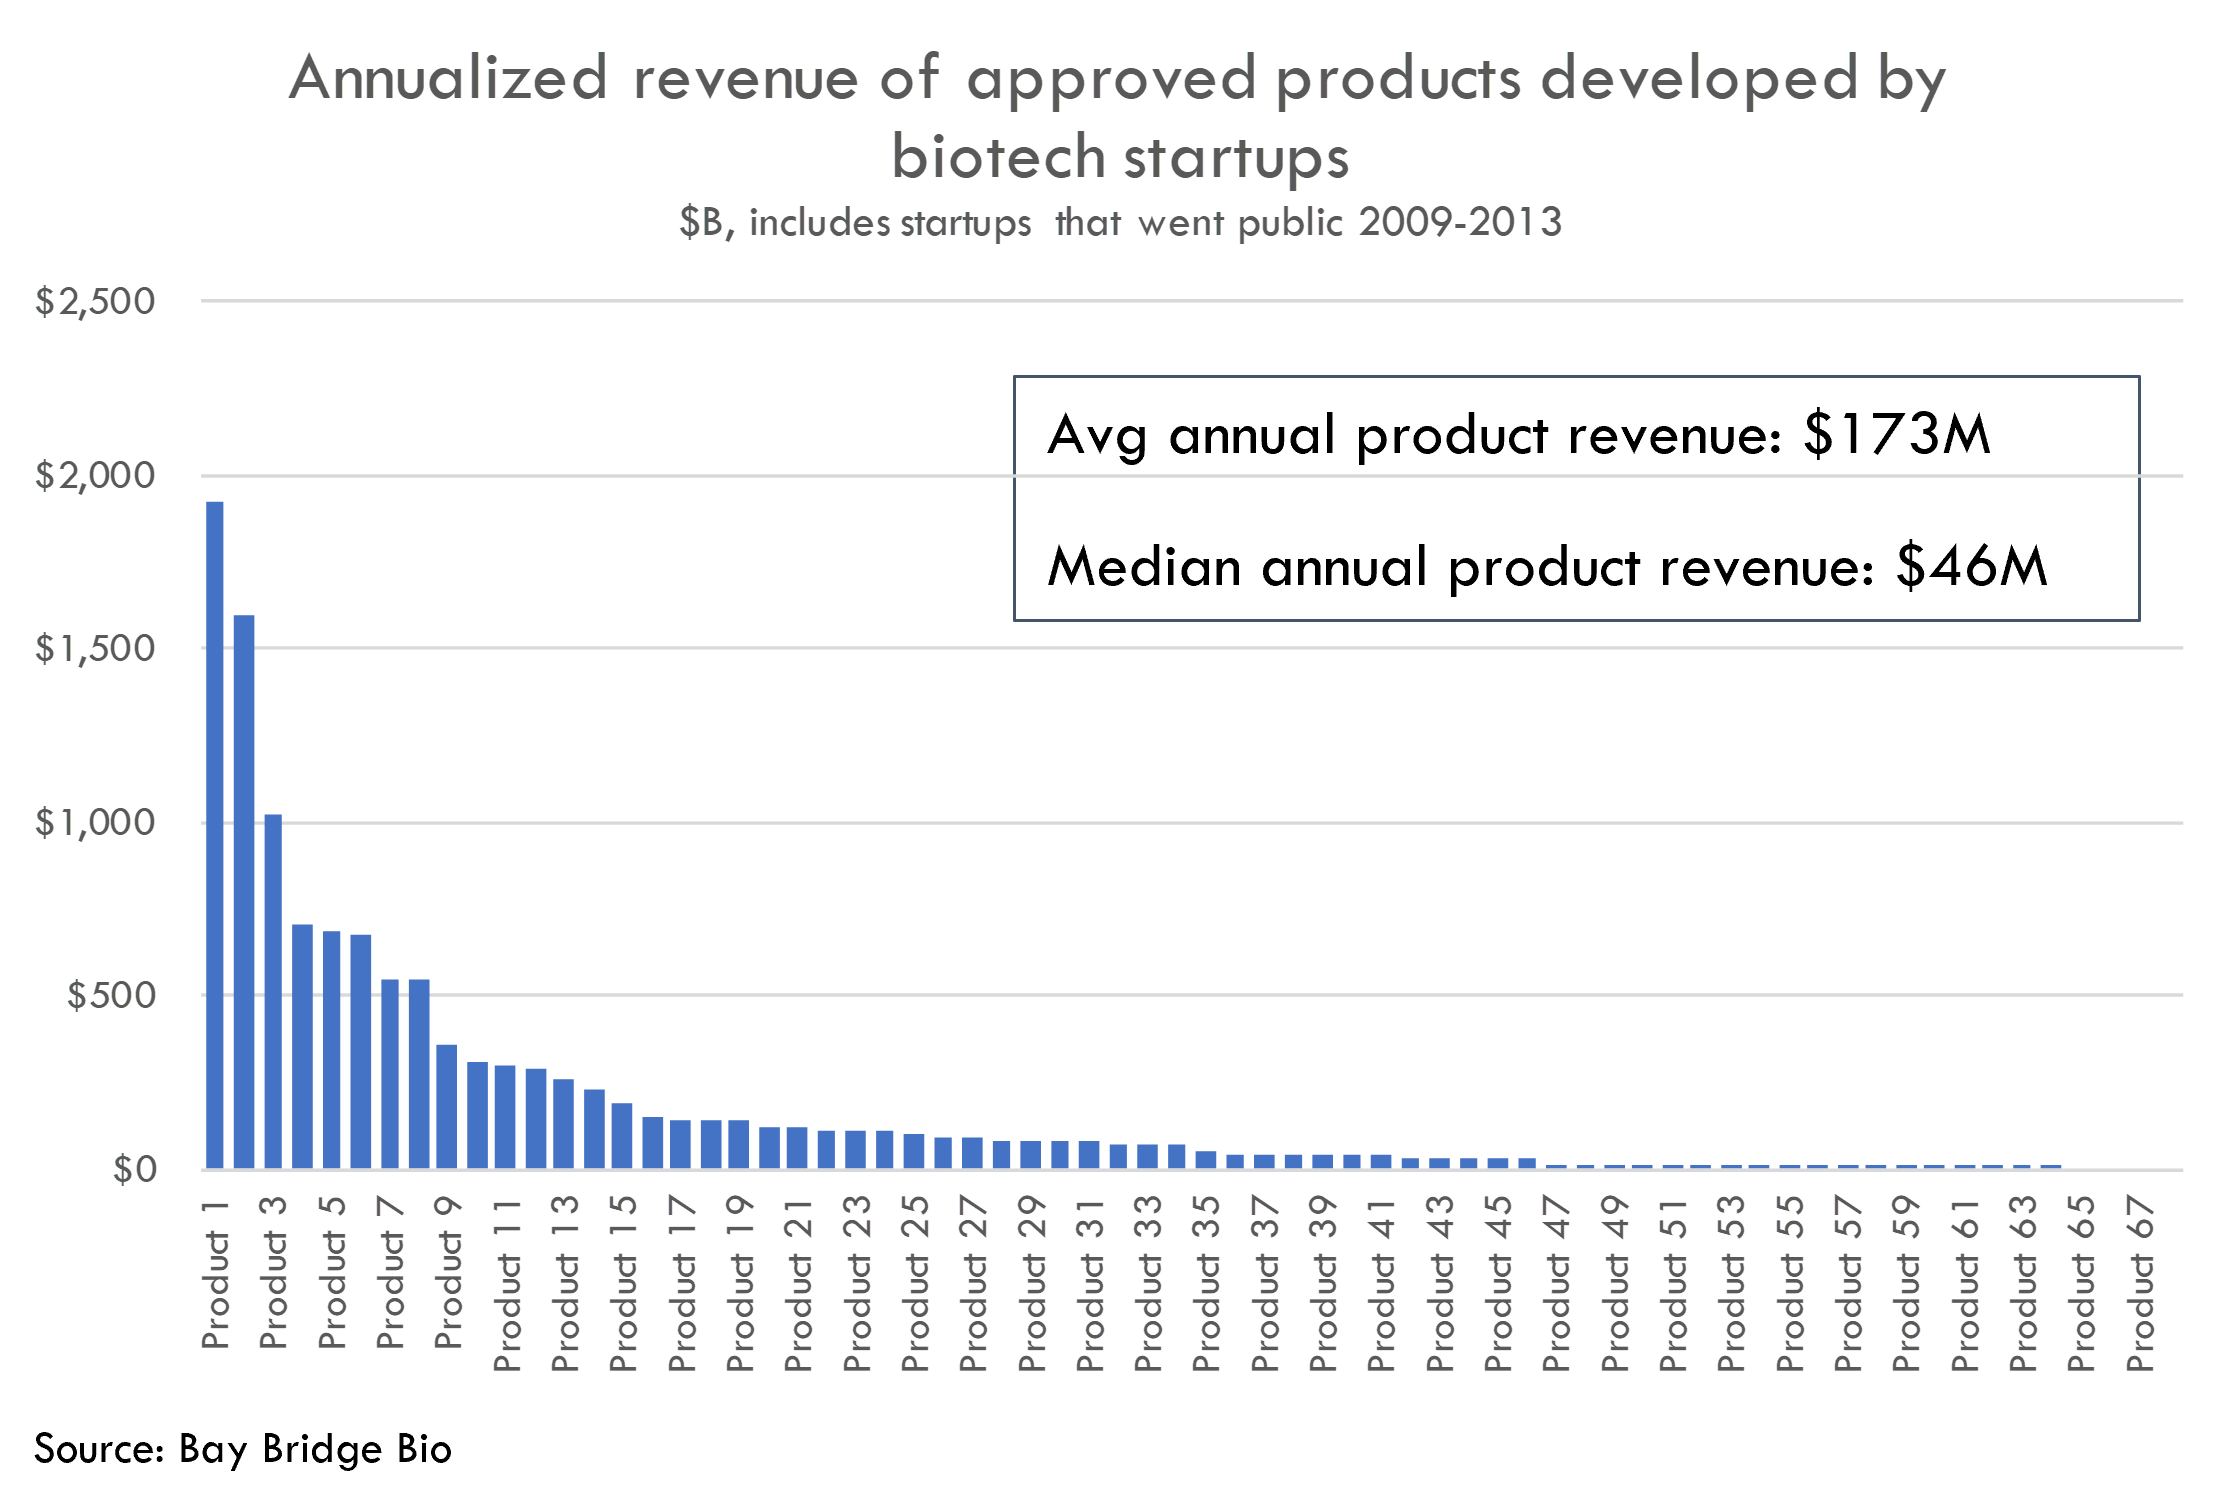
This seems lower than expected. While there are a few blockbusters, there are a lot of flops.
How does this compare to the industry as a whole? While not a direct comparison, we can look at Deloitte’s annual analysis of big pharma pipelines as an imperfect point of reference.
Deloitte estimates the average peak sales of late-stage (Phase 2 through filing – similar to the stages of the companies in our IPO cohort) big pharma products at $521M per product as of 2021.
At first glance, it looks like big pharma's drugs generate a lot more revenue than those developed by our IPO cohort. But due to methodological differences, the $521M figure is certainly overstated, and our figure is certainly understated. So we can't conclude much about the commercial potential of startup vs. big pharma drugs.
This $521M figure includes estimated peak sales of COVID drugs, as well as estimated peak sales for Aduhelm before it turned out to be a commercial flop. So this $521M figure is certainly artificially high (due to Aduhelm) and also represents a one-time boon that doesn’t represent a sustainable uptick in sales (due to inclusion of COVID drugs). In 2019, a more “normal” year, the estimated peak sales was $360M.
Further, Deloitte’s analysis uses estimated peak sales to estimate return on R&D. This is a logical approach, but is likely biased to the upside because the estimates are derived from analyst projections.
On the other hand, our revenue numbers for the startup cohort are based on annualized revenue from the latest quarter (Q2 2022) rather than peak sales, so our figures understate peak sales (more on these points later).
The cost of an approved drug
Regardless of whether drugs developed by startups make more money than those developed by big pharma, it is discouraging to see the average annual revenue for drugs developed by this cohort of startups is so low. It costs a lot to develop drugs, and they need to make a lot of money to make up for that high expense.
The Deloitte report pegs the cost to launch a big pharma drug at $2B as of 2021 (including the cost of failure). What about for our startup cohort?
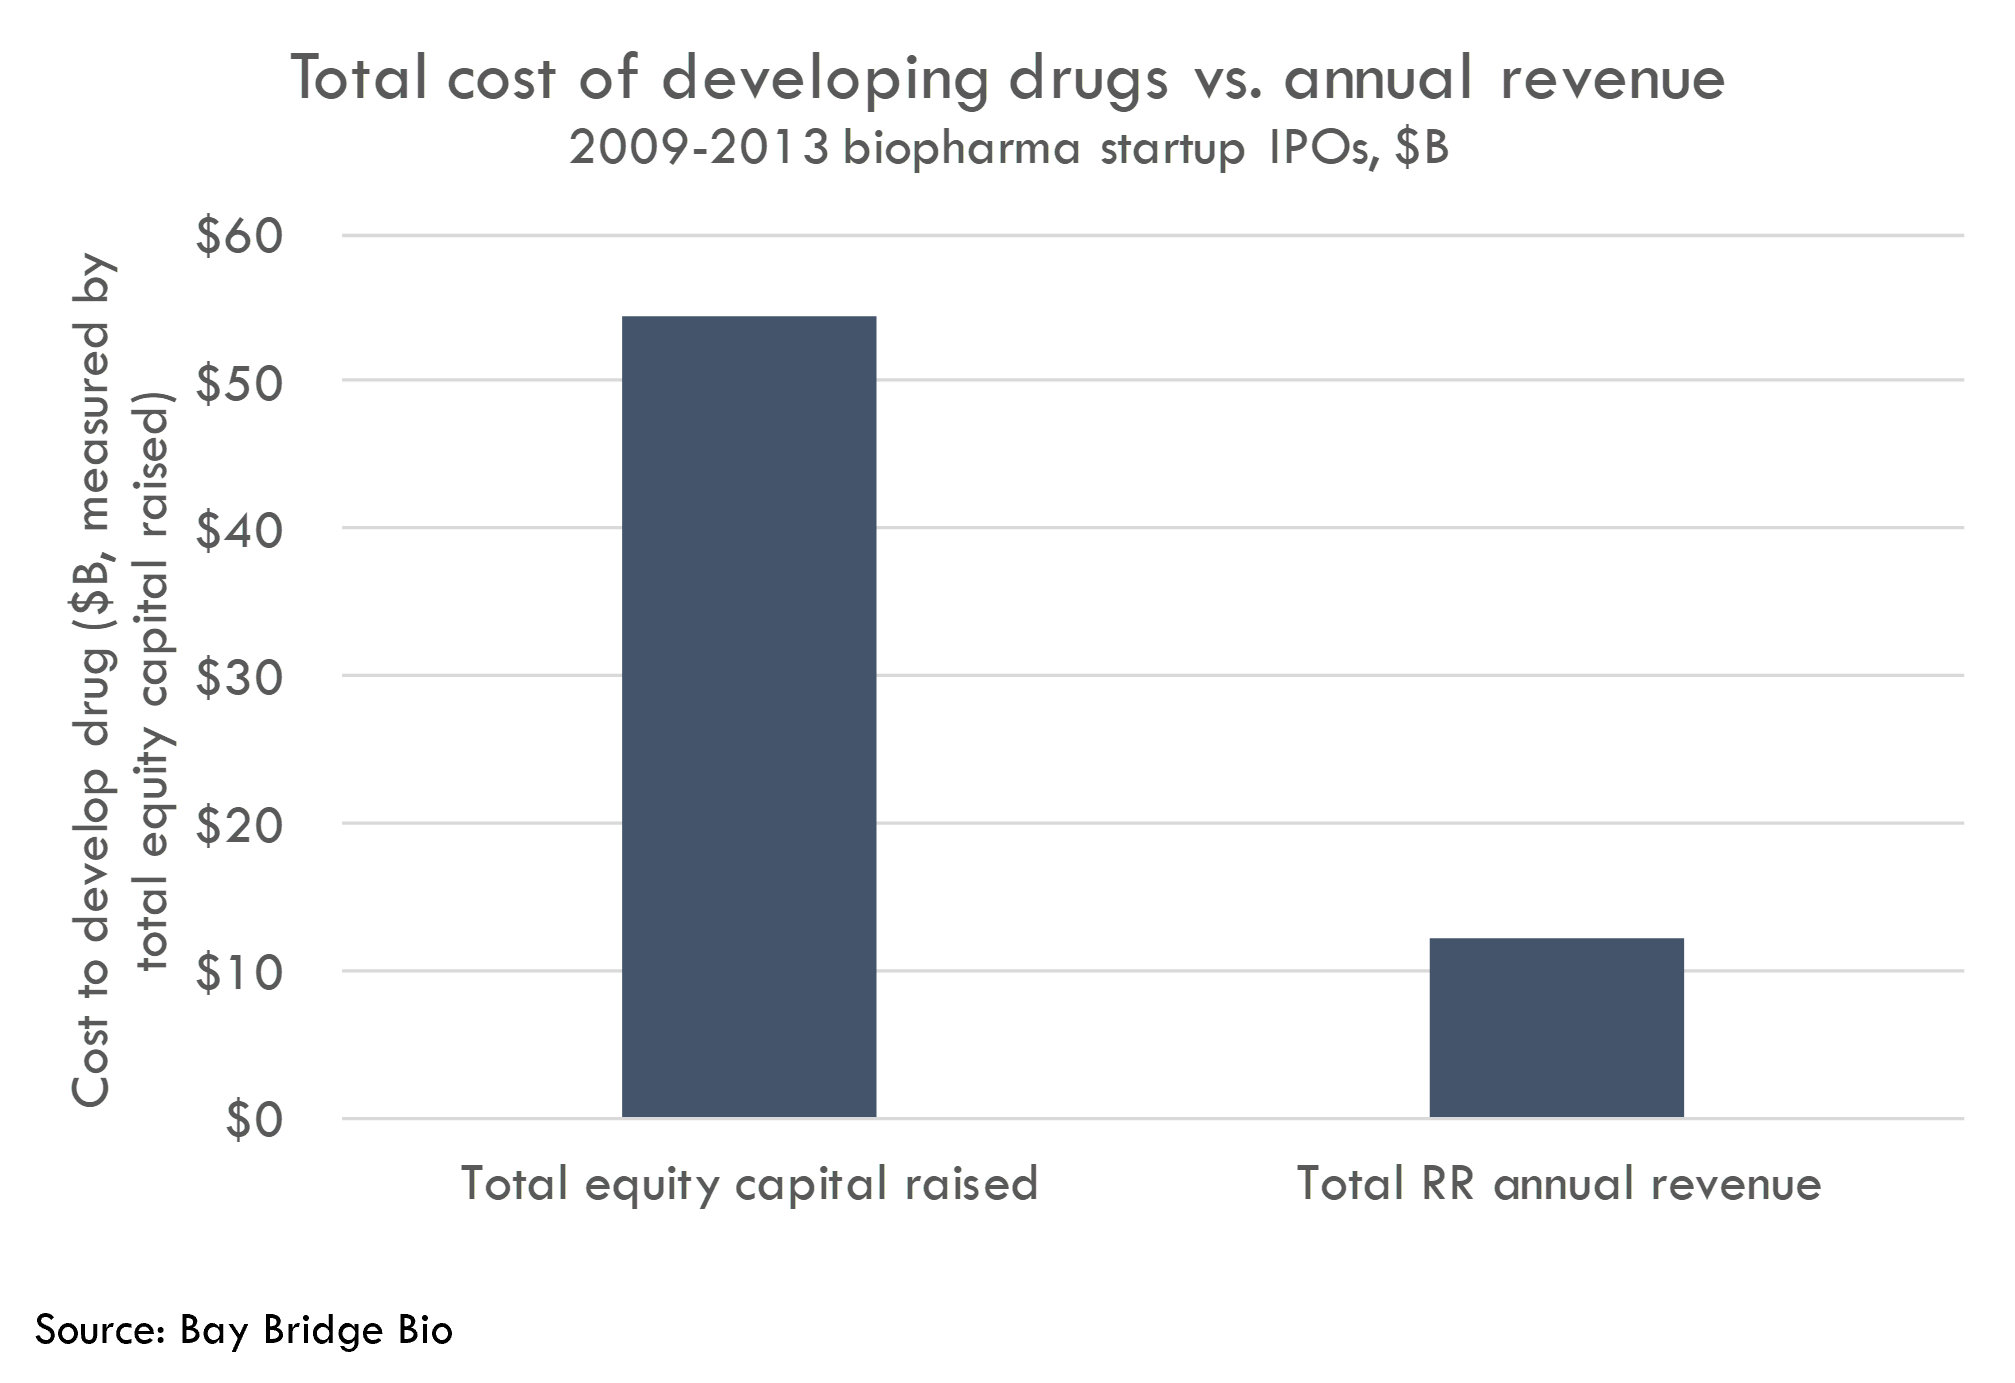
We estimate a cost of $768M per approved drug developed by our startup cohort. We don’t have cost data at an individual drug level for these companies, but we can calculate the total equity capital raised and divide that by the number of approved drugs. We count 71 approved drugs either developed by or licensed / acquired by the IPO cohort, and $54B in equity capital raised, representing $768M in cost per approved drug.1
Again, we can’t directly compare the $768M cost / startup drug and $2B cost / big pharma drug, as the methodologies used to calculate these figures are different. Thus it isn’t correct to say that startups spend a third of what big pharma spends developing a drug.
But getting too deep into the weeds trying to figure out if startups are a bit more or less productive at R&D than big pharma misses the point. Big pharma gets a very poor return on R&D investment. Startups need to be significantly better at R&D to justify the high risk of investing in them.
What can we learn about startup R&D productivity from looking at this cohort?
The easiest way to build DCF models
Build robust biotech valuation models in the browser. Then download a fully built excel model, customized with your inputs.
Returns on R&D investment
Deloitte calculates a return on big pharma’s late-stage R&D investment ranging from a low of 1.5% in 2019 up to 7.0% in 2021. The 7.0% in 2021 certainly overstates steady-state returns from R&D investment for the reasons listed above. Excluding COVID drugs brings projected IRR down to 3.2%, and excluding Aduhelm would decrease this further.
Does our startup cohort get a better than 2-5% return on R&D investment that big pharma generates? Our preliminary analysis suggests the startups maybe do a bit better -- around 5-10% -- but not much.
We will discuss actual returns in a later post, but for this post we use a back-of-the-envelope analysis. Because these startups are R&D stage companies focused on developing a handful of assets, we can use equity capital raised as a proxy for cost of developing and launching drugs. To calculate the money made from commercializing those drugs, we decided to use latest equity value or value at acquisition as a proxy for the value of future cash flows from selling the drugs. The alternate approach (which we will consider in another post) is to calculate actual revenues and profits, but doing so would not give companies credit for drugs yet to be launched (among other limitations).
Specifically, in this analysis we compare the current equity value of the startup cohort to the equity capital raised. This gets us a proxy for “cash-on-cash” return to all equity investors in these companies. Then we calculate the annual rate of return implied by the cash-on-cash return over a range of time periods (as we don’t have the exact timing of equity inflows for all of these companies).
These startups raised a total of $54B in equity capital, and their combined latest equity value (as of August 31, 2022), or value at acquisition, is $86B. This represents a ~1.7x return on equity capital investment over the life of these companies (for context, at market trough on June 14, 2022, the multiple was 1.5x).
This 1.7x represents an upper bound for the “cash-on-cash” return, as part of the current equity value is owned by management and employees, not investors. If we assume non-investor stakeholders own 20% of the company, then the return to equity holders is 1.4x. But for this analysis we will use the 1.7x, as we haven’t estimated the non-investor ownership of these companies.
We can calculate what this cash-on-cash figure represents in terms of annual rate of return, assuming a range of investment holding periods:
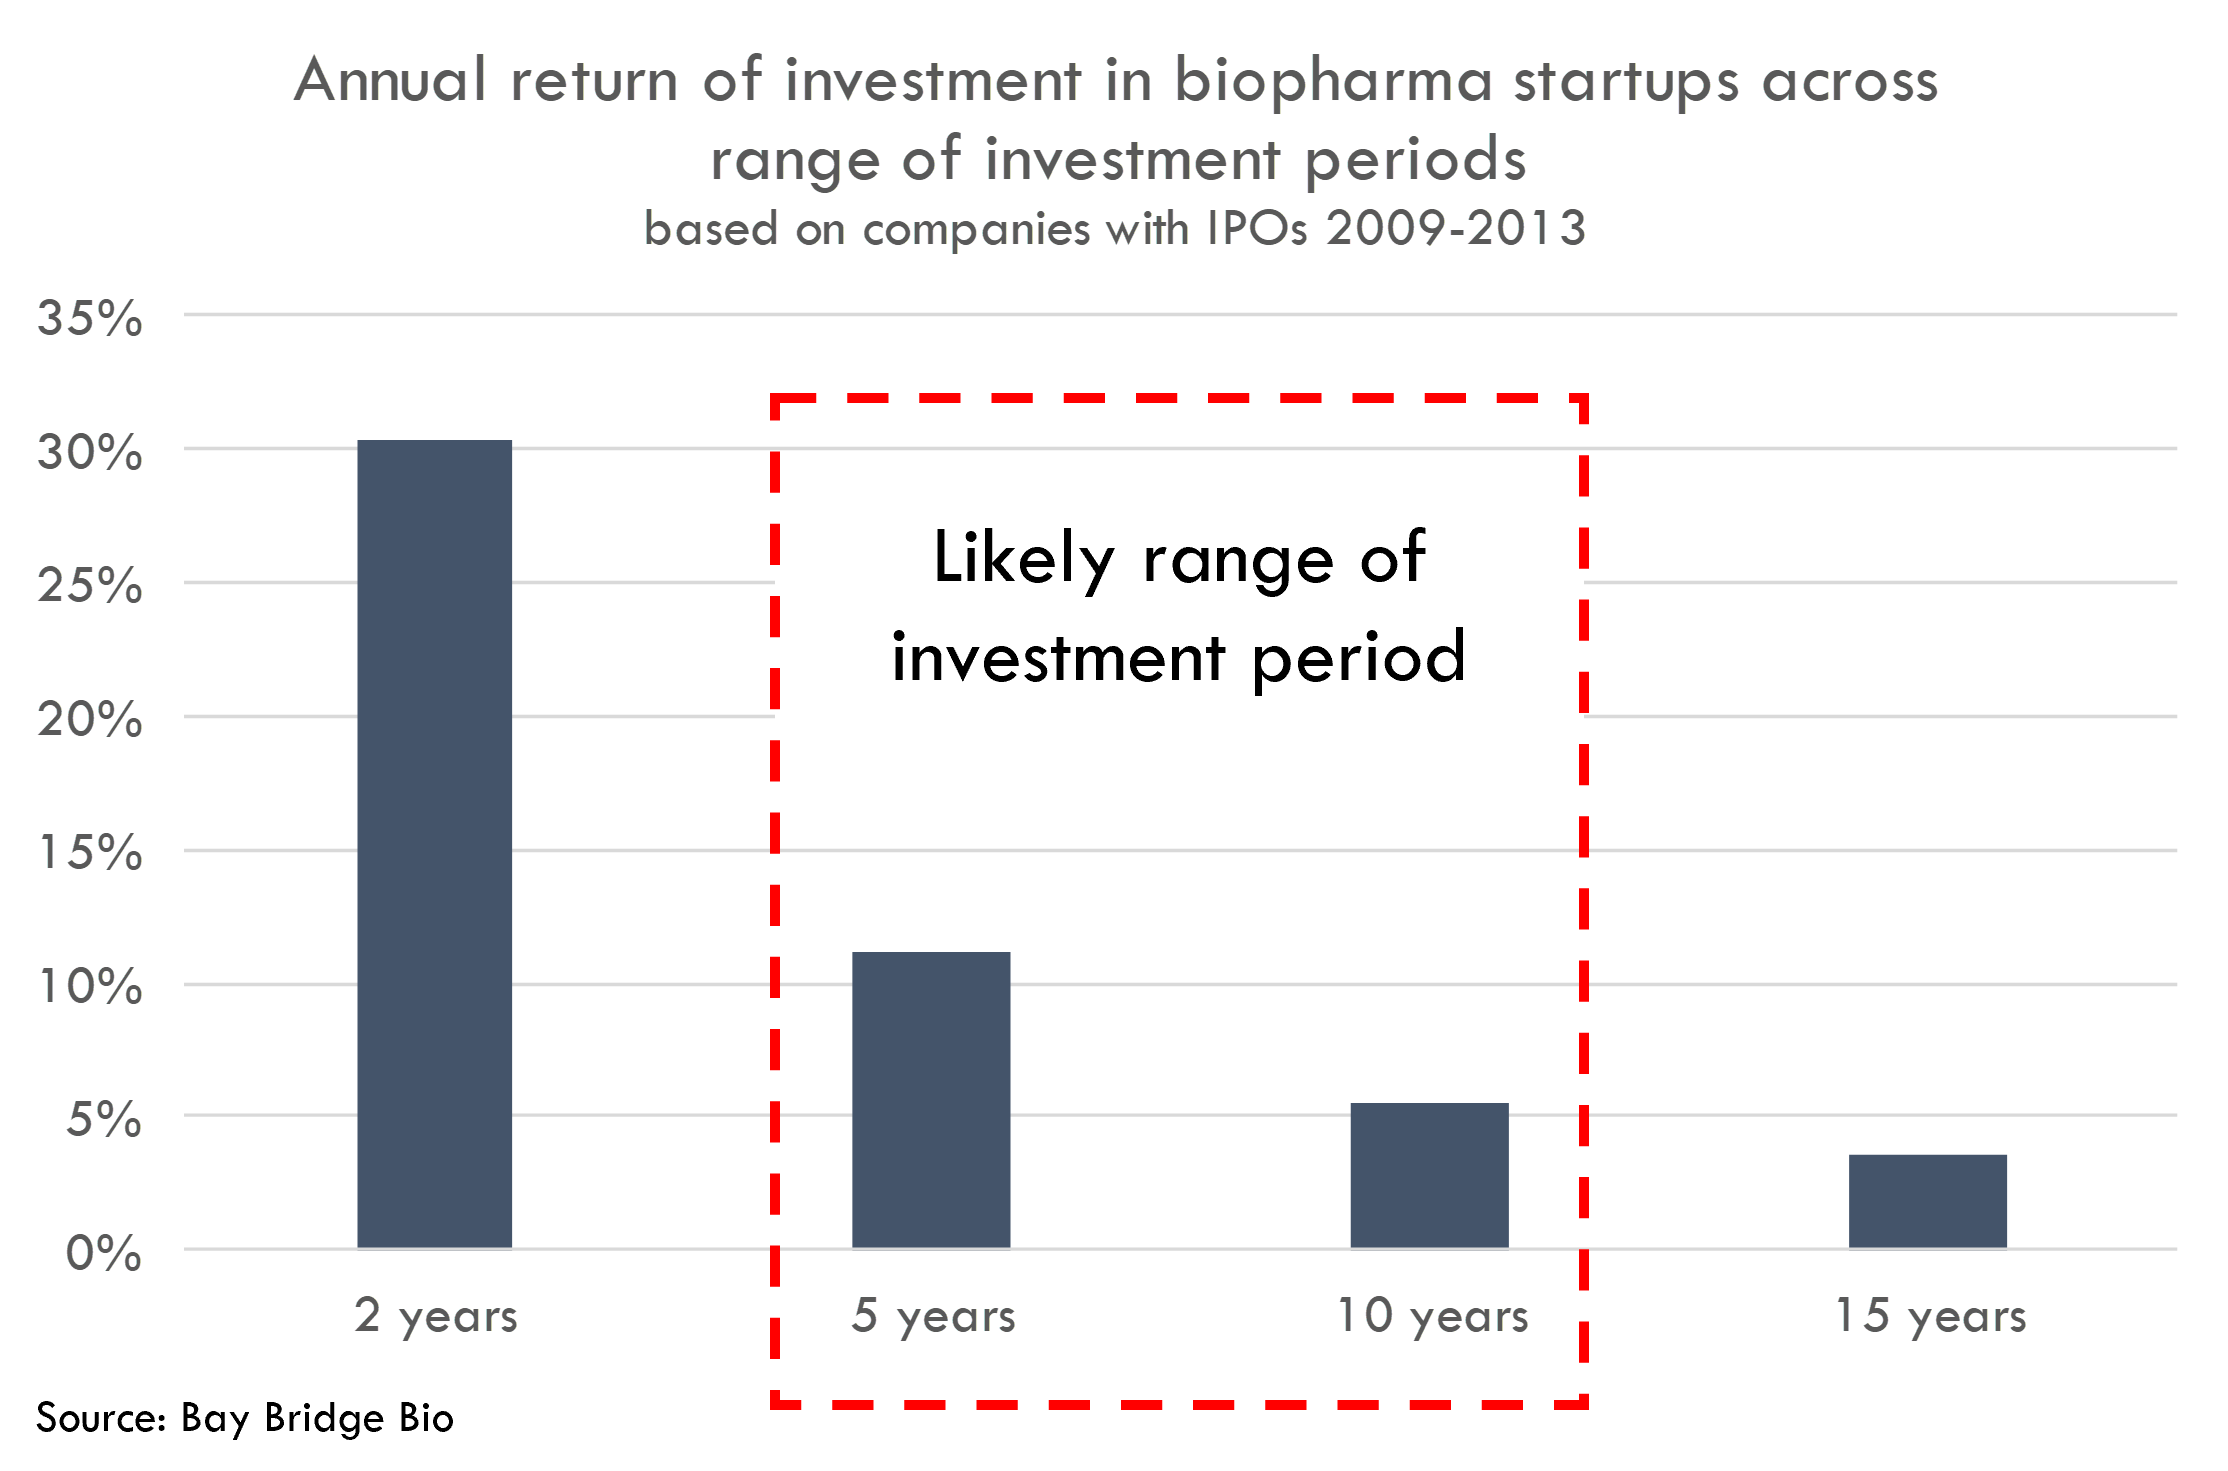
If the $54B was turned into $86B over two years, that would represent a 30.4% annual return. That is certainly too high, as these companies went public 10+ years ago and were founded even before then. If the holding period was 5 years, the annual return would be 11.2%. This five year holding period is also too short (and the 11.2% return too high), although if companies raised the bulk of their capital more recently (which would make sense as companies can raise more money when they become more advanced and less risky), then the five year holding period might be closer to the actual period than it seems.
A 10 year holding period – representing annual returns of 5.4% -- is probably too long. This is about when the companies went public, and at time of IPO, these companies had only raised $11B in aggregate. So most of the capital was raised post-IPO.
Thus, these startups most likely generated an annual return to all equity investors of 5-10% over the life of the companies. This does not compare favorably to the ~15% annual return for the S&P 500 over the last 10 years. And the 5-10% overstates the actual return, as it is based on a 1.7x cash-on-cash return that includes equity owned by managers and employees.
Using total equity raised and market cap allows us to analyze aggregate value creation to all equity holders over the life of a company and is a decent proxy for R&D productivity. To get a sense of the long-term returns to early invetors, we can simply look at change in stock price from IPO to today. The average IPO has returned 123% since IPO, and the median has returned -64%. The S&P returned 257% from December 2009 to August 2022, and 118% from December 2013 to August 2022. On an absolute basis, investing in these IPOs at the IPO price produces returns that are closer to the S&P's return, but these returns are inferior on a risk-adjusted basis.
Commercial potential and capital efficiency deserve more attention
Investors and startups appear to have done well improving the odds of clinical success. But that is not enough. More attention needs to be paid to the commercial prospects of a drug – even before getting into the clinic. Cost of manufacturing and scale up (especially for gene and cell therapies), pricing and reimbursement, logistics and distribution, and competition are critical in determining whether a company is built to last.
Bluebird bio is perhaps the canonical example of the importance of commercial factors in a companies’ success. The company developed one of the first approved gene therapies that is a first-in-class potential functional cure for patients with a severe unmet need, but it cost them billions of dollars to get their first drug approved due to the complexities of working with a new modality. They priced too high to be commercially viable in the EU, and although ICER gives their $2.8M price tag for their lead drug a favorable review, it is too early to tell how payers in the US will respond. Launching their product will prove costly and logistically complex. They are also entering a market with intense competition – although they are first in class, others are hot on their heels. As of yet few investors or acquirors are betting the launch goes well: the company raised over $4B, but their current market cap is just $500M.
Lessons we can learn from these companies
The good news is that this analysis is limited to a cohort of companies that went public a decade ago. If there have been any improvements in R&D since then, this analysis doesn't capture it.
We can also learn from the lessons of these companies to improve R&D productivity. Startups have made a lot of progress improving the odds of FDA approval by focusing on improved trial design, taking advantage of supportive regulatory pathways, better translational medicine and target validation, and developing for targeted patient populations. There is plenty of reason to believe the industry can continue to iterate, this time improving how we think about commercial potential of new drugs.
The substrates for improving R&D productivity are out there: innovative modalities, better computational tools, and new technologies. But it isn't enough to simply plug these technologies into the same frameworks and organizational structures that exist in incubment biopharma companies. Innovative companies must improve upon the decision-making processes and incentive structures that can lead to suboptimal long-term R&D productivity.
Specifically, we'd hypothesize that companies would be better off in the long-term if they:
- Avoid going into hyper-competitive areas, even if it is easier to raise money for "validated" targets and indications
- Develop a deep and comprehensive view on the commercial potential of programs before deciding to pursue an indication or program
- Be more disciplined in evaluating true competitive advantage
- When assessing the competitive landscape, account for the uncertainty around how the competitive landscape will evolve over the development timeline of their programs
- Generally operate in a more capital-efficient manner (less money spent on platform development not tied to specific products or partnerships, more ruthless program prioritization, focusing on differentiation in ways other than keeping up with competitors' spend and fundraising, better general financial management)
Doing these things may make it harder to fundraise in the short-term, but improve the likelihood of building a lasting company.
The easiest way to build DCF models
Build robust biotech valuation models in the browser. Then download a fully built excel model, customized with your inputs.
Other limitations of the analysis
We interpret this analysis as a provocative but preliminary finding. We don't want to overgeneralize the findings to a broader sample of companies, although we do "update our priors" regarding the how we think about potential returns. We had previously found that startups get more drugs approved per dollar of R&D spend than big pharma. The analysis in this post supports that conclusion -- that startups get drugs approved at a higher rate, and spend less per approved drug -- but suggests that despite this, the overall return on R&D investment for startups is still low. In the face of Eroom's Law and a multi-decade decline in industry R&D productivity, it appears that getting more drugs approved per dollar invested is not enough to revitalize R&D. But we can't conclude this decisively, because this is just one analysis that is subject to several limitations.
The major limitation of this analysis is that we analyze a cohort of companies founded over a decade ago. There are reasons to think that more recently founded companies would outperform this cohort (more advanced technology enabling companies to develop more valuable drugs), but there are also reasons to think that may not be the case (recently funded companies may be less capital efficient due to frothier funding markets, and more funded companies means more competition). In any event, we think it is worth conducting similar analyses on more recent cohorts of startups.
Another limitation is that we are not measuring peak sales, only the most recent annualized quarterly revenue. Thus we will not capture the full potential of recently launched drugs, and thus understate the revenue generated by this cohort. Most notably, bluebird bio’s ZYNTEGLO, a first-in-class potential functional cure for sickle cell disease and beta thalassemia, was just approved; sotatercept, which was a big value driver in Merck’s $11.5B acquisition of Acceleron in 2021, is not yet approved; Tavneos, which underpinned Amgen’s recent $4B acquisition of ChemoCentryx, was just launched; and Chimerix recently received FDA approval for a product as well.
None of these newly launched products are included in our revenue calculations. However, our calculation of equity “cash-on-cash” return (the 1.7x number above) includes any value attributed to these products by acquirors and equity investors. Further, given the age of this cohort of startups, these new products won’t generate meaningful revenue until over a decade after IPO (and even longer after the company’s founding), so the discounted value of these products to early investors is much lower than if products hit the market earlier.
While we cannot adjust our average revenue figure for drugs that haven’t launched, we can observe whether the launched products are near peak by looking at the quarter-over-quarter growth:
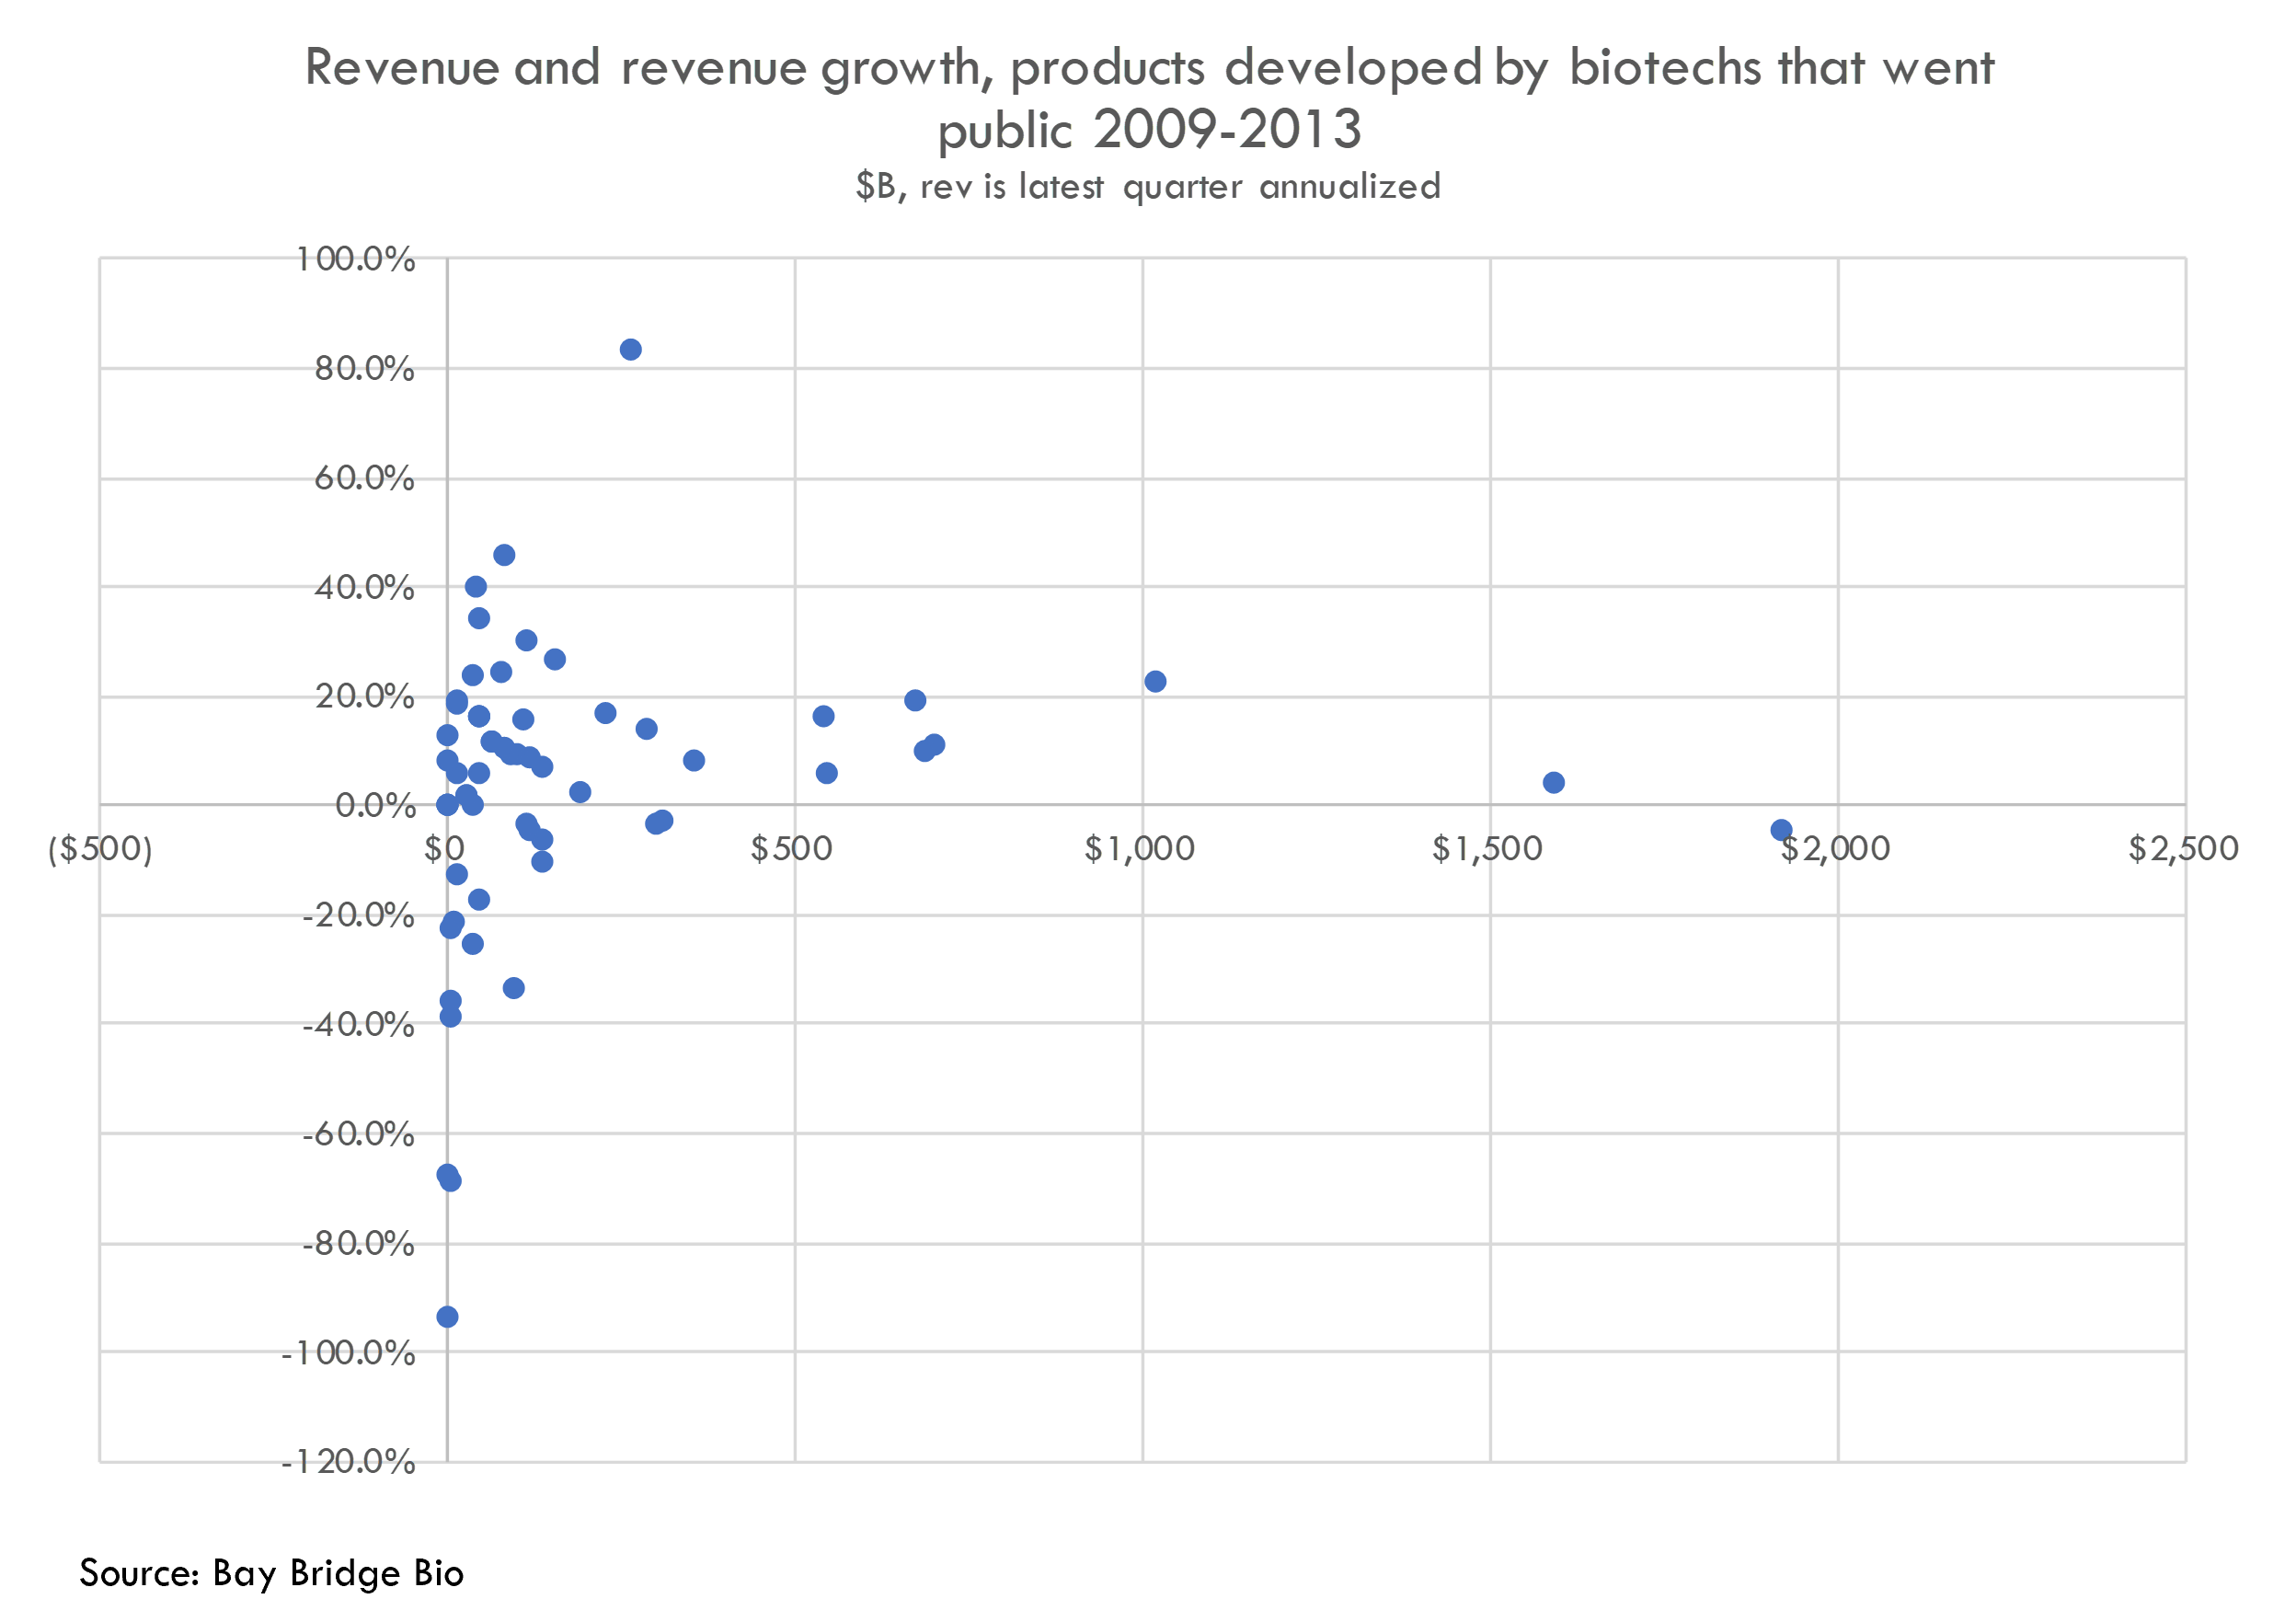
Fifteen of these products have higher-than-average revenue (over $170M in annualized revenue). Of these, two are growing faster than 20% a quarter and eight are growing faster than 10% per quarter. There are two additional products doing $100M+ in annualized revenue and growing faster than 20% per quarter. These products have blockbuster potential.
Another major limitation is that this analysis does not account for the timing of investments. We benchmarked the annual returns that would yield a 1.7x cash-on-cash return over a variety of timescales, but this is a very rough analysis. It makes intuitive sense that larger capital infusions are made as companies approach commercialization (to scale up manufacturing, build commercial infrastructure and run large Phase 2/3 trials), and these later-stage investments would be less risky and thus require a lower return. If a large bolus of the $54B in capital raised funds lower-risk activities, then an aggregate return of mid-single digits across all capital invested is less concerning (although, to be clear, still not good).
There are other limitations as well (we do not include net debt in the cost of developing drugs, we measure current market cap at one point in time and do not account for the volatility of market cap, and others). We view this as a preliminary but provocative analysis and will continue to explore this area.
1 This does not include debt, so understates the true cost of developing drugs. While most of these companies do not have much debt, some have large amounts (for example, HZNP has almost $3B in debt).