Why do drug companies charge such high prices?
Virtually all new drugs are developed by for-profit companies. When investors or companies decide whether to fund a project, they evaluate whether they can price drugs at levels that 1) cover the cost of developing the drug, 2) cover the cost of other failed R&D projects and 3) return a profit.
This tool calculates the minimum drug price that would accomplish those three objectives, given a set of assumptions about the drug. It also calculates how much the drug would have to improve patients' health, in terms of QALYs gained per year of treatment, to be cost-effective. You can change the inputs below to see how that affects price.
Breakeven price
$99,989
Annual price per patient that yields NPV of 0
Cost-effectiveness threshold
0.67 QALYs
Min. QALY gain per year of treatment for cost-effectiveness at $150,000/QALY
Explore different scenarios
You can play around with different assumptions below. What if the drug can be approved more quickly or with fewer clinical studies under special FDA programs? What if the company didn't need to make a profit? What if the drug treats a very rare condition? What if you weed out more drugs in preclinical testing, thus improving Phase 2 and 3 success rates?
Our default assumptions for R&D costs come from DiMasi et al, Journal of Health Economics 2016. Our default commercial assumptions are described below, as is our methodology.
Don't know what these terms mean? There are short explanations below. p(TS) is "probability of technical success", ie probability a drug doesn't fail at a given stage.
Pre-human studies
| Category | Current value | Input |
|---|---|---|
| Target-to-hit cost | $2.1M | |
| Target-to-hit time | 1 years | |
| Target-to-hit p(TS) | 80% | |
| Hit-to-lead cost | $5.3M | |
| Hit-to-lead time | 2 years | |
| Hit-to-lead p(TS) | 75% | |
| Lead optimization cost | $21.0M | |
| Lead optimization time | 2 years | |
| Lead optimization p(TS) | 85% | |
| Preclinical development cost | $10.5M | |
| Preclinical development time | 1 years | |
| Preclinical development p(TS) | 69% |
Human studies
| Category | Current value | Input |
|---|---|---|
| Phase 1 cost | $34.7M | |
| Phase 1 time | 2 years | |
| Phase 1 p(TS) | 60% | |
| Phase 2 cost | $80.4M | |
| Phase 2 time | 2 years | |
| Phase 2 p(TS) | 36% | |
| Phase 3 cost | $350.2M | |
| Phase 3 time | 3 years | |
| Phase 3 p(TS) | 62% | |
| FDA submission cost | $59.3M | |
| FDA submission time | 1 years | |
| FDA submission p(TS) | 90% |
Post-approval
| Category | Current value | Input |
|---|---|---|
| Discount rate | 20% | |
| Peak patients treated / year | 50,000 | |
| Time to peak sales | 5 years | |
| Patent life post-approval | 11 years | |
| COGS % of sales | 10% | |
| SG&A % of sales | 30% | |
| R&D % of sales | 5% | |
| Tax rate | 20% | |
| Cost / QALY gain threshold | $150,000 |
Breakeven price
$99,989
Cost-effectiveness threshold
0.67 QALYs
Prefer to play around with a spreadsheet? Enter your email to download the model in excel
By signing up you agree to our privacy policy and terms of service and you agree to receive periodic updates from us (you can unsubscribe at any time).
Lowering drug prices
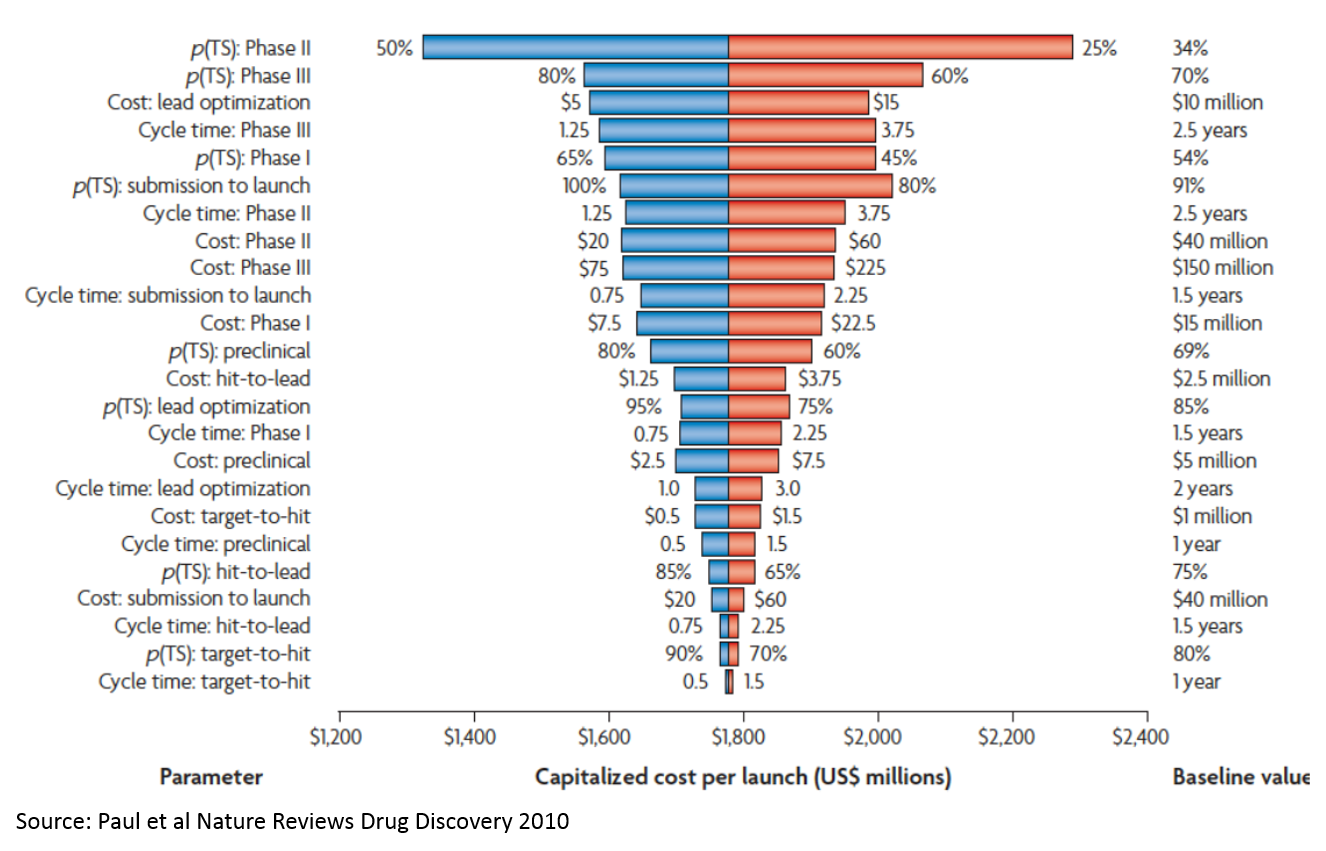
This model provides a framework for thinking about how to lower drug prices. Which variables move the needle the most? Which can we control? A lot of what startups and entrepreneurs do is find ways to move these levers to increase probability of success, lower costs, and increase value.
The Paul et al Nature Reviews Drug Discovery 2010 study I referenece in this analysis has a nice chart showing how sensitive the cost of drug development (and ultimately the price of drugs) is to various assumptions:
This model is also a helpful framework for understanding how the drug industry works. For example, why are most new drugs focused on cancer or severe rare disease? First of all, curing cancer or a fatal rare disease provides a lot of QALY gains, so companies can charge higher prices. Secondly, FDA has programs that reduce the time and cost of clinical development for drugs that treat life-threatening illness (to see this in our model, try reducing Phase 3 costs and time to zero, and p(TS) to 100%).
For a real-world example of how these factors influence price, check out my case study of Zolgensma, a gene therapy that is expected to be one of the most expensive drugs ever.
Explanation of terms
For a more detailed overview of the drug development process, see this post.
The cost fields represent the out-of-pocket cash spent at each stage of the R&D process. The time fields represent how long it takes to go from the start of one stage to the start of the next. p(TS) is the probability of technical success: the probability that a drug doesn't fail at a given stage.
Prehuman studies are in vitro and animal studies. There are two main purposes for these studies: 1) to better understand whether a drug will work in humans before embarking on expensive human studies and 2) to meet FDA's requirements for "preclinical" testing to make sure a drug is safe for testing in humans.
A target is a molecule that the drug is intended to interact with. Researchers select targets that they believe are highly involved in causing disease or making disease worse.
The target-to-hit process entails screening large libraries of chemical or biologic matter to find "hits". Hits are molecules that interact with the target in the desired way. I use the term "matter" rather than "drugs" because the compounds used in these screens often don't have the qualities needed to be a drug: they may be toxic, they may not get to the right place within the body, etc. They are just starting points for future drug development efforts.
The hit-to-lead process involves selecting the most promising hits, testing them, and modifying to make them more "drug like". Maybe the drug is not specific to the target, and binds to other molecules in undesirable ways. Maybe not enough of it is absorbed into the blood stream. Maybe it accumulates in certain tissues and causes side effects. During the hit-to-lead process, researchers try to weed out bad compounds and improve promising ones.
During lead optimization, the most promising hits are further optimized. If a lead is sufficiently promising, it enters preclinical development.
Preclinical development involves testing compounds to make sure they are ready for human studies. These studies include safety testing in animals and in vitro systems, pharmacology studies, studies of how the drug is absorbed, distributed in the body, metabolized and excreted, and toxicity studies. Many of these studies are required by FDA for initiation of human studies and must be conducted in accordance with regulations.
Phase 1 studies are the first human studies. These are often done in healthy people, rather than patients. The goals of Phase 1 studies are typically to test preliminary safety in humans and to select dosing for later studies.
The goal of Phase 2 studies is generally to get a preliminary read on the drug's effectiveness, and also to assess safety in patients (as opposed to healthy volunteers in Phase 1). Phase 2 studies are also used to inform design of Phase 3 studies.
Phase 3 studies are "pivotal" studies to determine the drug's safety and effectiveness in large numbers of patients in rigorous, well-controlled studies.
After all required testing is completed, companies submit to FDA an application for approval, complete with detailed reports and data from all relevant studies.
The discount rate is a financial concept that represents the "cost of capital". This is the return investors or companies expect to generate on their investment in a given project. You can think of it as the opportunity cost of money: if the investor didn't fund this project, what return could they get on another investment?
Peak patients treated / year is fairly self-explanatory. The time to peak sales reflects the fact that it takes time for the market to adopt a new drug.
The patent life post-approval represents the amount of time a company can sell a drug until patents expire. When patents expire, generic drugs flood the market, and profits decline to near zero. Generally US patents have 20-year terms. Patents are often issued before a drug is approved, so by the time a company can sell a drug, much of its patent life has elapsed.
COGS, SG&A and R&D % of sales represent the costs a company incurs in selling a drug. COGS is cost of goods sold (manufacturing plants, personnel, raw materials, etc.). SG&A is selling, general and administrative expense (corporate overhead, office space and equipment, cost of salespeople, executives, administrative personnel, etc.). R&D is research and development expense (personnel, third party manufacturing and research groups, labs, equipment, materials, etc.). In this model I assume no R&D investment into additional new drugs, so these R&D costs reflect post-approval studies.
Tax rate represents the taxes companies pay on profits. Taxes for companies that do a lot of R&D can be complicated, but in this model we just assume a 20% tax rate on all profits.
The cost / QALY gain threshold is a way to assess whether a treatment is cost-effective. A QALY is a "quality-adjusted life year". One QALY represents a year in perfect health. If someone is sick for a year, then that is represented by a QALY of less than one, depending on how sick they are. A "QALY gain" represents how many QALYs a patient has with a given drug compared to if they received standard care without the drug. Health economists often determine cost-effectiveness with a dollar per QALY gained threshold. Often a treatment is deemed cost-effective if it costs less than $100,000-150,000 per QALY gained.
Methodology
The default assumptions for pre-approval costs come from two studies, Paul et al Nature Reviews Drug Discovery 2010 and DiMasi et al, Journal of Health Economics 2016. These are some of the most-cited studies of the costs of drug development.
DiMasi 2016 has more recent estimates of drug development costs, so that was the primary source for data. DiMasi provides an aggregate estimate of prehuman costs but does not break out costs by individual stage of prehuman studies. Paul 2010 has more detail on prehuman costs, however, so I used the cost, p(TS) and time data for prehuman costs from Paul 2010. I adjusted the costs / prehuman stage from Paul by a multiplier to reflect the higher overall prehuman costs seen in DiMasi. The multiplier was simply total prehuman costs in DiMasi / total prehuman costs in Paul.
I inflation-adjusted costs to 2019 USD. DiMasi costs were in 2013 dollars, and Paul costs were in 2008 dollars. I used an inflator of 1.1869 for 2008 UDS and 1.097 for 2013 USD.
These studies reflect only R&D costs for drugs, excluding administrative costs and overhead. However, administrative costs are required for drug development and should be included. Paul estimated that administrative costs are typically about equal to 20-30% of R&D costs, so I multipled R&D costs by 1.25 to adjust for administrative costs. I quickly looked at the public financial statements of a few early-stage biotech companies, and this 25% number is about right.
I assumed a 20% discount rate because most FDA approved drugs are developed by small companies (often these small companies are acquired by big pharma companies before approval). Small companies are typically funded by venture capital investors. Venture capital investors target ~20% returns for their funds, so I used that as a default assumption for cost of capital. DiMasi used a 10.5% discount rate and Paul used an 11% discount rate. These lower rates are reflective of the cost of capital for a larger company, which is lower than that of a venture-backed startup.
I used 50,000 as the peak number of patients treated per year. There is obviously a huge range for this, and there's no particular reason I chose 50,000 by default. From what I can tell, the blockbuster checkpoint inhibitors treat on the order of this many patients per year. Many new drugs treat "orphan", or rare, diseases, that often treat only a few thousand patients per year.
I used 5 years as the default years to peak market penetration. This is somewhat arbitrary and will vary for each drug.
The COGS, SG&A and R&D assumptions are somewhat arbitrary but seem reasonable based on my experience. Modeling these costs as a percentage of sales is a common heuristic, though it is not the most precise method. For R&D, I assume companies don't reinvest in developing new drugs, so the R&D reflects post-approval studies. The tax rate roughly represents the new US corporate tax rate. As a simplifying assumption I assume no R&D or other tax credits.
I assume $150,000 as the QALY cost-effectiveness threshold. This is on the higher end of the acceptability thresholds, but still within accepted ranges.
To calculate minimum breakeven price, I used a net present value (NPV) analysis. I solved for the price that resulted in an NPV of zero for the drug. You can download a spreadsheet that shows the methodology below, or contact me if you're interested in the Python script.
To see our methodology in excel, enter your email to download the model
By signing up you agree to our privacy policy and terms of service and you agree to receive periodic updates from us (you can unsubscribe at any time).