How to calculate the value of drugs and biotech companies
This post will use an interactive valuation model to explain how drugs and biotech companies are valued. I'll describe key concepts related to risk and value in biotech, provide some examples of how risk and valuation drive company strategy, and examine whether current biotech valuations are in-line with fundamentals.
The post is accompanied by two tools that can help you apply this knowledge: an interactive drug valuation calculator and an excel spreadsheet with an example of how a drug company might be valued.
NOTE: this tool is meant to be illustrative and is not intended to be used for company valuation. If you need a robust valuation model, or help picking apart a counterparty's model, we offer consulting services. Book a call to learn how we've helped clients add tens of millions to their valuation.
The drug valuation calculator
The below chart shows the output of the drug valuation calculator: how the value of a drug program grows over time, assuming the program is successful at each stage (if it fails, the value generally goes to zero). The inputs are cost and time of development, probability of success at various stages of the drug development process, market size, costs of commercialization, and discount rate.
The chart also shows the total investment required to reach each stage, and the probability that a drug reaches a given stage. Later in this post, there's a tool that lets you play around with the assumptions driving this valuation model. The "active case" changes when you change the assumptions below; the "base case" represents the original assumptions.
Rotate your screen to view chart
Value at start of program
$0M
Probability of FDA approval: 4%
Investment required for approval: $520M
Value at start of Phase 1
$88M
Probability of FDA approval: 12%
Investment required for approval: $520M
Value at start of Phase 2
$249M
Probability of FDA approval: 20%
Investment required for approval: $486M
Value at start of Phase 3
$1,121M
Probability of FDA approval: 56%
Investment required for approval: $405M
Unfamiliar with the terminology? Click here for a brief glossary +
For a more detailed overview of the drug development process, see this post.
A target is a molecule that the drug is intended to interact with. Researchers select targets that they believe are highly involved in causing disease or making disease worse.
The target-to-hit process entails screening large libraries of chemical or biologic matter to find "hits". Hits are molecules that interact with the target in the desired way. I use the term "matter" rather than "drugs" because the compounds used in these screens often don't have the qualities needed to be a drug: they may be toxic, they may not get to the right place within the body, etc. They are just starting points for future drug development efforts.
The hit-to-lead process involves selecting the most promising hits, testing them, and modifying to make them more "drug like". Maybe the drug is not specific to the target, and binds to other molecules in undesirable ways. Maybe not enough of it is absorbed into the blood stream. Maybe it accumulates in certain tissues and causes side effects. During the hit-to-lead process, researchers try to weed out bad compounds and improve promising ones.
During lead optimization, the most promising hits are further optimized. If a lead is sufficiently promising, it enters preclinical development.
Preclinical development involves testing compounds to make sure they are ready for human studies. These studies include safety testing in animals and in vitro systems, pharmacology studies, studies of how the drug is absorbed, distributed in the body, metabolized and excreted, and toxicity studies. Many of these studies are required by FDA for initiation of human studies and must be conducted in accordance with regulations.
Phase 1 studies are the first human studies. These are often done in healthy people, rather than patients. The goals of Phase 1 studies are typically to test preliminary safety in humans and to select dosing for later studies.
The goal of Phase 2 studies is generally to get a preliminary read on the drug's effectiveness, and also to assess safety in patients (as opposed to healthy volunteers in Phase 1). Phase 2 studies are also used to inform design of Phase 3 studies.
Phase 3 studies are "pivotal" studies to determine the drug's safety and effectiveness in large numbers of patients in rigorous, well-controlled studies.
After all required testing is completed, companies submit to FDA an application for approval, complete with detailed reports and data from all relevant studies.
The discount rate is a financial concept that represents the "cost of capital". This is the return investors or companies expect to generate on their investment in a given project. You can think of it as the opportunity cost of money: if the investor didn't fund this project, what return could they get on another investment?
Peak patients treated / year is fairly self-explanatory. The time to peak sales reflects the fact that it takes time for the market to adopt a new drug.
The patent life post-approval represents the amount of time a company can sell a drug until patents expire. When patents expire, generic drugs flood the market, and profits decline to near zero. Generally US patents have 20-year terms. Patents are often issued before a drug is approved, so by the time a company can sell a drug, much of its patent life has elapsed.
COGS, SG&A and R&D % of sales represent the costs a company incurs in selling a drug. COGS is cost of goods sold (manufacturing plants, personnel, raw materials, etc.). SG&A is selling, general and administrative expense (corporate overhead, office space and equipment, cost of salespeople, executives, administrative personnel, etc.). R&D is research and development expense (personnel, third party manufacturing and research groups, labs, equipment, materials, etc.). In this model I assume no R&D investment into additional new drugs, so these R&D costs reflect post-approval studies.
Tax rate represents the taxes companies pay on profits. Taxes for companies that do a lot of R&D can be complicated, but in this model we just assume a 20% tax rate on all profits.
Risk and value in biotech
Biotech companies can be incredibly valuable even if they are years away from generating revenue. We can't use typical valuation metrics to value pre-revenue biotech companies, but biotech has its own valuation principles. A few of note:
Value is closely tied to risk: In other industries, growth, either of profits, revenues, or users, drives value creation. In drug development, derisking drives value creation. Companies "derisk" their science by conducting scientific experiments or clinical studies. The more rigorous the experiment, the more value is created if the experiment is successful.
Risk is often binary: Because value creation is tied to risk reduction, and because risk is reduced through experiments and studies, a company's value often changes dramatically when new data from studies is released. Because studies are generally blinded to prevent bias, the data from a study is usually revealed all at once at the end of a study. So big swings in value can happen literally overnight. Positive binary events often catalyze a fundraise.
Drugs become exponentially more valuable over time: Drugs aren't really that valuable until around Phase 2. This is why most venture capitalists prefer to fund companies that develop their own drugs rather than just discover new targets or hits and then try to sell them to pharma. In our model, each hit is worth $2.7M and it costs $2.1M to get each hit. A Phase 2 molecule is worth $249M and it costs $74M to get to Phase 2. A Phase 3 molecule is worth $1.1B and it costs $154M to get to that point. Unless you can generate high-quality hits or leads very quickly and cheaply, you're better off taking drugs to the clinic yourselves rather than partnering too early.
Valuations are highly sensitive to discount rate: It takes a long time to develop drugs, and most of the value is created after many years, so a drug's value is highly sensitive to the discount rate. Developing drugs requires lots of capital, and because drug development is risky, capital can be expensive. So cost of capital can be one of the biggest components of the cost of drug development. Try changing the discount rate in the model below to 2% (roughly the rate of inflation). Drugs become much more valuable. As a corollary, lower discount rates can allow companies to drastically reduce drug prices. Check out this drug pricing calculator to see how discount rate affects price.
The easiest way to build biotech rNPV models
Build rNPV models in the browser with just a few clicks, and export to excel
Risk and value drive business strategy
Understanding the nature of risk and value in drug development can explain a lot about how biotech startups work today. Below I'll describe a few trends in biotech, and how you can use the drug valuation tool to illustrate how different scenarios affect valuation.
Personalized medicine
Personalized medicine has many definitions, but in biopharma it generally means using genetic biomarkers to identify the right patients for clinical studies. There is evidence that using biomarkers to select patients for clinical studies improves success rates (Wong et al Biostastics 2018, BIO Clinical Development Success Rates 2006-2015).
To see the effect of biomarkers on valuation, put the following values into the assumptions table below:
- Phase 1 p(TS): 75%
- Phase 2 p(TS): 50%
- Phase 3 p(TS): 75%
Orphan drugs
Orphan drugs are drugs designed to treat "orphan", or rare, diseases. Because these diseases affect so few patients, there has historically been less research into these diseases compared to more prevalent conditions. To incentivize rare disease research, FDA has created several programs that help reduce the cost and time of developing drugs for severe rare disease. The most widely known is the Orphan Drug Act, but there are several other FDA programs that are arguably just as, if not more, important in reducing the cost of orphan drug development (although these programs are not specific for orphan drugs): Accelerated Approval, Breakthrough Designation, Fast Track, and Priority Review.
These programs can reduce the cost and risk of drug development by letting companies get "conditional approval" with just Phase 2 data, providing more feedback to companies throughout the regulatory process, and allowing companies to conduct smaller clinical studies. To model the impact of this, try the following:
- Phase 3 cost: $0
- Phase 3 time: 0
- Phase 3 p(TS): 100%
- FDA submission cost: $30M
- FDA submission p(TS): 95%
- Peak patients treated / year: 5,000
- Price: $300,000
AI-driven drug discovery
There is a lot of hype around AI in drug discovery and development these days. The valuation model can provide a sense of the impact of AI on drug development.
Most AI programs involve using AI in the "target-to-hit" stage, and some can also do hit-to-lead and lead optimization work. Let's model the following:
- Target-to-hit cost: $1M
- Hit-to-lead cost: $0.5M
- Hit-to-lead time: 1
- Lead optimization cost: $15M
- Lead optimization time: 1
Note that this doesn't change the overall valuation too much. However, it allows you to get to preclinical development in just 3 years for total cost of $17M, compared to 5 years and $28M. This can be quite valuable for cash-strapped early-stage startups. I don't know too much about the capabilities of AI drug-discovery tools, so the values above are just estimates.
Assumptions table: explore different scenarios
The default case models a drug that treats 50,000 patients a year. The model assumes a price of $45,759 per year of treatment. This drug price yields an NPV of 0 at the start of the project, and thus is the minimum drug price that would attract investment, given our assumptions about the cost of development.
Our default assumptions for R&D costs come from DiMasi et al, Journal of Health Economics 2016. Below, you can change these assumptions and see how they impact valuation at each stage, and read more about our methodology.
The most challenging part of valuing drugs is figuring out which assumptions are the right ones. This model is only as good as the underlying assumptions.
Pre-human studies
| Category | Current value | Input |
|---|---|---|
| Target-to-hit cost | $2.1M | |
| Target-to-hit time | 1 years | |
| Target-to-hit p(TS) | 80% | |
| Hit-to-lead cost | $5.3M | |
| Hit-to-lead time | 2 years | |
| Hit-to-lead p(TS) | 75% | |
| Lead optimization cost | $21.0M | |
| Lead optimization time | 2 years | |
| Lead optimization p(TS) | 85% | |
| Preclinical development cost | $10.5M | |
| Preclinical development time | 1 years | |
| Preclinical development p(TS) | 69% |
Human studies
| Category | Current value | Input |
|---|---|---|
| Phase 1 cost | $34.7M | |
| Phase 1 time | 2 years | |
| Phase 1 p(TS) | 60% | |
| Phase 2 cost | $80.4M | |
| Phase 2 time | 2 years | |
| Phase 2 p(TS) | 36% | |
| Phase 3 cost | $350.2M | |
| Phase 3 time | 3 years | |
| Phase 3 p(TS) | 62% | |
| FDA submission cost | $54.9M | |
| FDA submission time | 1 years | |
| FDA submission p(TS) | 90% |
Post-approval
| Category | Current value | Input |
|---|---|---|
| Discount rate | 13% | |
| Price | $45,759 | |
| Peak patients treated / year | 50,000 | |
| Time to peak sales | 5 years | |
| Patent life post-approval | 11 years | |
| COGS % of sales | 10% | |
| SG&A % of sales | 30% | |
| R&D % of sales | 5% | |
| Tax rate | 20% | |
| Cost / QALY gain threshold | $150,000 |
Prefer to play around with a spreadsheet? Enter your email to download the model in excel
By signing up you agree to our privacy policy and terms of service and you agree to receive periodic updates from us (you can unsubscribe at any time).
Are these valuations realistic?
The assumptions in our model come from large studies of the cost of actual pharma drug development programs, and the model uses a common valuation technique (though somewhat simplified), so it should be a decent approximation of value. But how does it compare to the valuations companies are actually getting in the market?
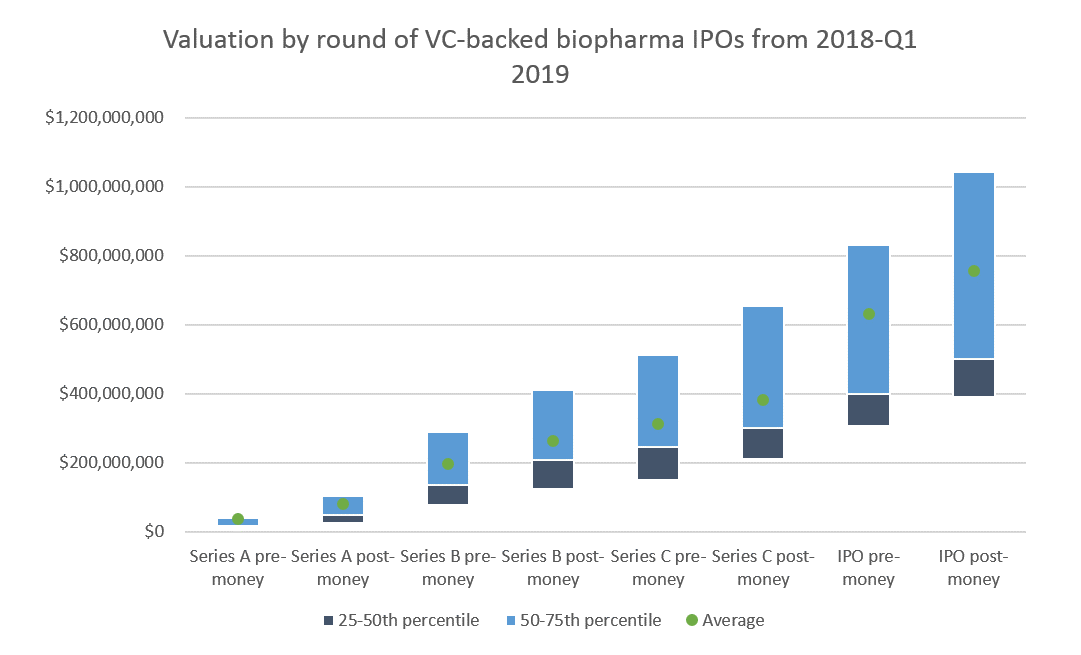
I've collected some data on biopharma startup and IPO valuations that we can use to sanity-check the model.
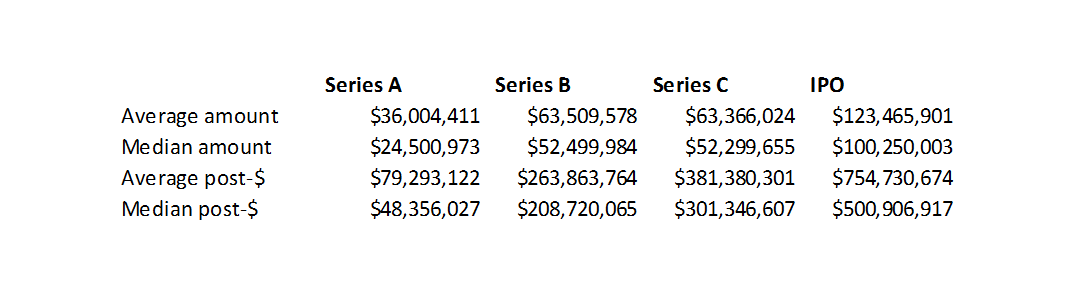
Series A valuations are generally around $40-100M. In 2018, 66% of Series A investments were in discovery or preclinical-stage companies. These venture rounds would get the companies through Phase 1, or at least most of preclinical development.
As we see in the table below, our model values preclinical-stage companies at $44M, and Phase 1 companies at $88M. Which is not too far off from the market.
About 50% of Series B investments were in discovery or preclinical companies. 35% were in Phase 1 or 2. Series B valuations were generally $150-300M, with a sizable minority valued at $300-400M. This is roughly in line with the Phase 1 and Phase 2 valuations in our model.
Finally, 42% of companies that went public in 2018 were in Phase 2 and 32% were in Phase 1. The average IPO post-money was $754M and the median was $501M. These valuations are in line with the higher-end of the Phase 1 and Phase 2 valuations in our model. Most of these companies were cancer or rare disease companies, where you can often get approval on just Phase 2 data. So these Phase 2 companies may be more like Phase 3 companies, which would make their valuations a bit more in line with our model.
The easiest way to build biotech rNPV models
Build rNPV models in the browser with just a few clicks, and export to excel
Valuation by year from our model
| Year | Current stage | NPV at beginning of year, $M | Cumulative cost of program, beginning of year, $M | p(TS) of current stage | Probability of approval at current stage |
|---|
Methodology
This model uses a simple risk-adjusted NPV model to calculate valuation. This is a common technique in biotech and pharma.
An increasingly common, but more complex, valuation technique is "real options" valuation. This technique better captures manager's ability to make different business decisions in response to new information. For example, if a competitor's drug generates very impressive data that management doesn't think it can compete with, it may decide to abandon a program. Or if a company's drug is better than anticipated, management may decide to double down.
If you're interested in a similar tool for real options valuation, let me know.
The default assumptions for pre-approval costs come from two studies, Paul et al Nature Reviews Drug Discovery 2010 and DiMasi et al, Journal of Health Economics 2016. These are some of the most-cited studies of the costs of drug development.
DiMasi 2016 has more recent estimates of drug development costs, so that was the primary source for data. DiMasi provides an aggregate estimate of prehuman costs but does not break out costs by individual stage of prehuman studies. Paul 2010 has more detail on prehuman costs, however, so I used the cost, p(TS) and time data for prehuman costs from Paul 2010. I adjusted the costs / prehuman stage from Paul by a multiplier to reflect the higher overall prehuman costs seen in DiMasi. The multiplier was simply total prehuman costs in DiMasi / total prehuman costs in Paul.
I inflation-adjusted costs to 2019 USD. DiMasi costs were in 2013 dollars, and Paul costs were in 2008 dollars. I used an inflator of 1.1869 for 2008 UDS and 1.097 for 2013 USD.
These studies reflect only R&D costs for drugs, excluding administrative costs and overhead. However, administrative costs are required for drug development and should be included. Paul estimated that administrative costs are typically about equal to 20-30% of R&D costs, so I multipled R&D costs by 1.25 to adjust for administrative costs. I quickly looked at the public financial statements of a few early-stage biotech companies, and this 25% number is about right.
I used 50,000 as the peak number of patients treated per year. There is obviously a huge range for this, and there's no particular reason I chose 50,000 by default. From what I can tell, the blockbuster checkpoint inhibitors treat on the order of this many patients per year. Many new drugs treat "orphan", or rare, diseases, that often treat only a few thousand patients per year.
I used 5 years as the default years to peak market penetration. This is somewhat arbitrary and will vary for each drug.
To determine what price to model for the drug, I calculated the price that yielded an NPV of zero at the beginning of the projection period, using this drug pricing calculator tool.
The COGS, SG&A and R&D assumptions are somewhat arbitrary but seem reasonable based on my experience. Modeling these costs as a percentage of sales is a common heuristic, though it is not the most precise method. For R&D, I assume companies don't reinvest in developing new drugs, so the R&D reflects post-approval studies. The tax rate roughly represents the new US corporate tax rate. As a simplifying assumption I assume no R&D or other tax credits.
For each year in the projection period, I calculated NPV from the current year to the end of the projection period from the perspective of an investor or acquiror considering doing a deal with the company. I assumed a 13% discount rate. Although the cost of capital will change over time, depending on the stage of the company, I used a constant discount rate because I am modeling valuation from the perspective of an acquiror, and implicitly using an acquiror's cost of capital. A 13.5% discount rate is potentially a bit high for an acquiror, but represents a "blend" of the discount rates typically seen for larger pharma companies and startups. I used a "blended" discount rate rather than just using the acquiror's or target's discount rate.
For the sake of simplicity, I just modeled the income statement, so the cash flows are not adjusted for depreciation and amortization, working capital adjustments, and capex.
You may also like...
Valuations of biotech startups from Series A to IPO
Biotech finance 101: for finance professionals
The world's most expensive drug? A case study of Zolgensma
Top biotech venture capital funds of 2018
Bay Bridge Bio Startup Database
Venture returns from biopharma IPOs, 2018-Q1 2019
Prefer to play around with a spreadsheet? Enter your email to download the model in excel
By signing up you agree to our privacy policy and terms of service and you agree to receive periodic updates from us (you can unsubscribe at any time).