Valuations of biotech startups from Series A to IPO
Richard Murphey, 1/12/2022
Biotech stocks have had a bad several months. Private markets are still healthy, but a sustained decrease in IPO volume will impact private markets.
To help understand the potential magnitude of this impact, this post analyzes the valuations of private rounds of companies that went public in the last several years. Many of these companies are trading at valuations lower than that of their last private round.
A few takeaways:
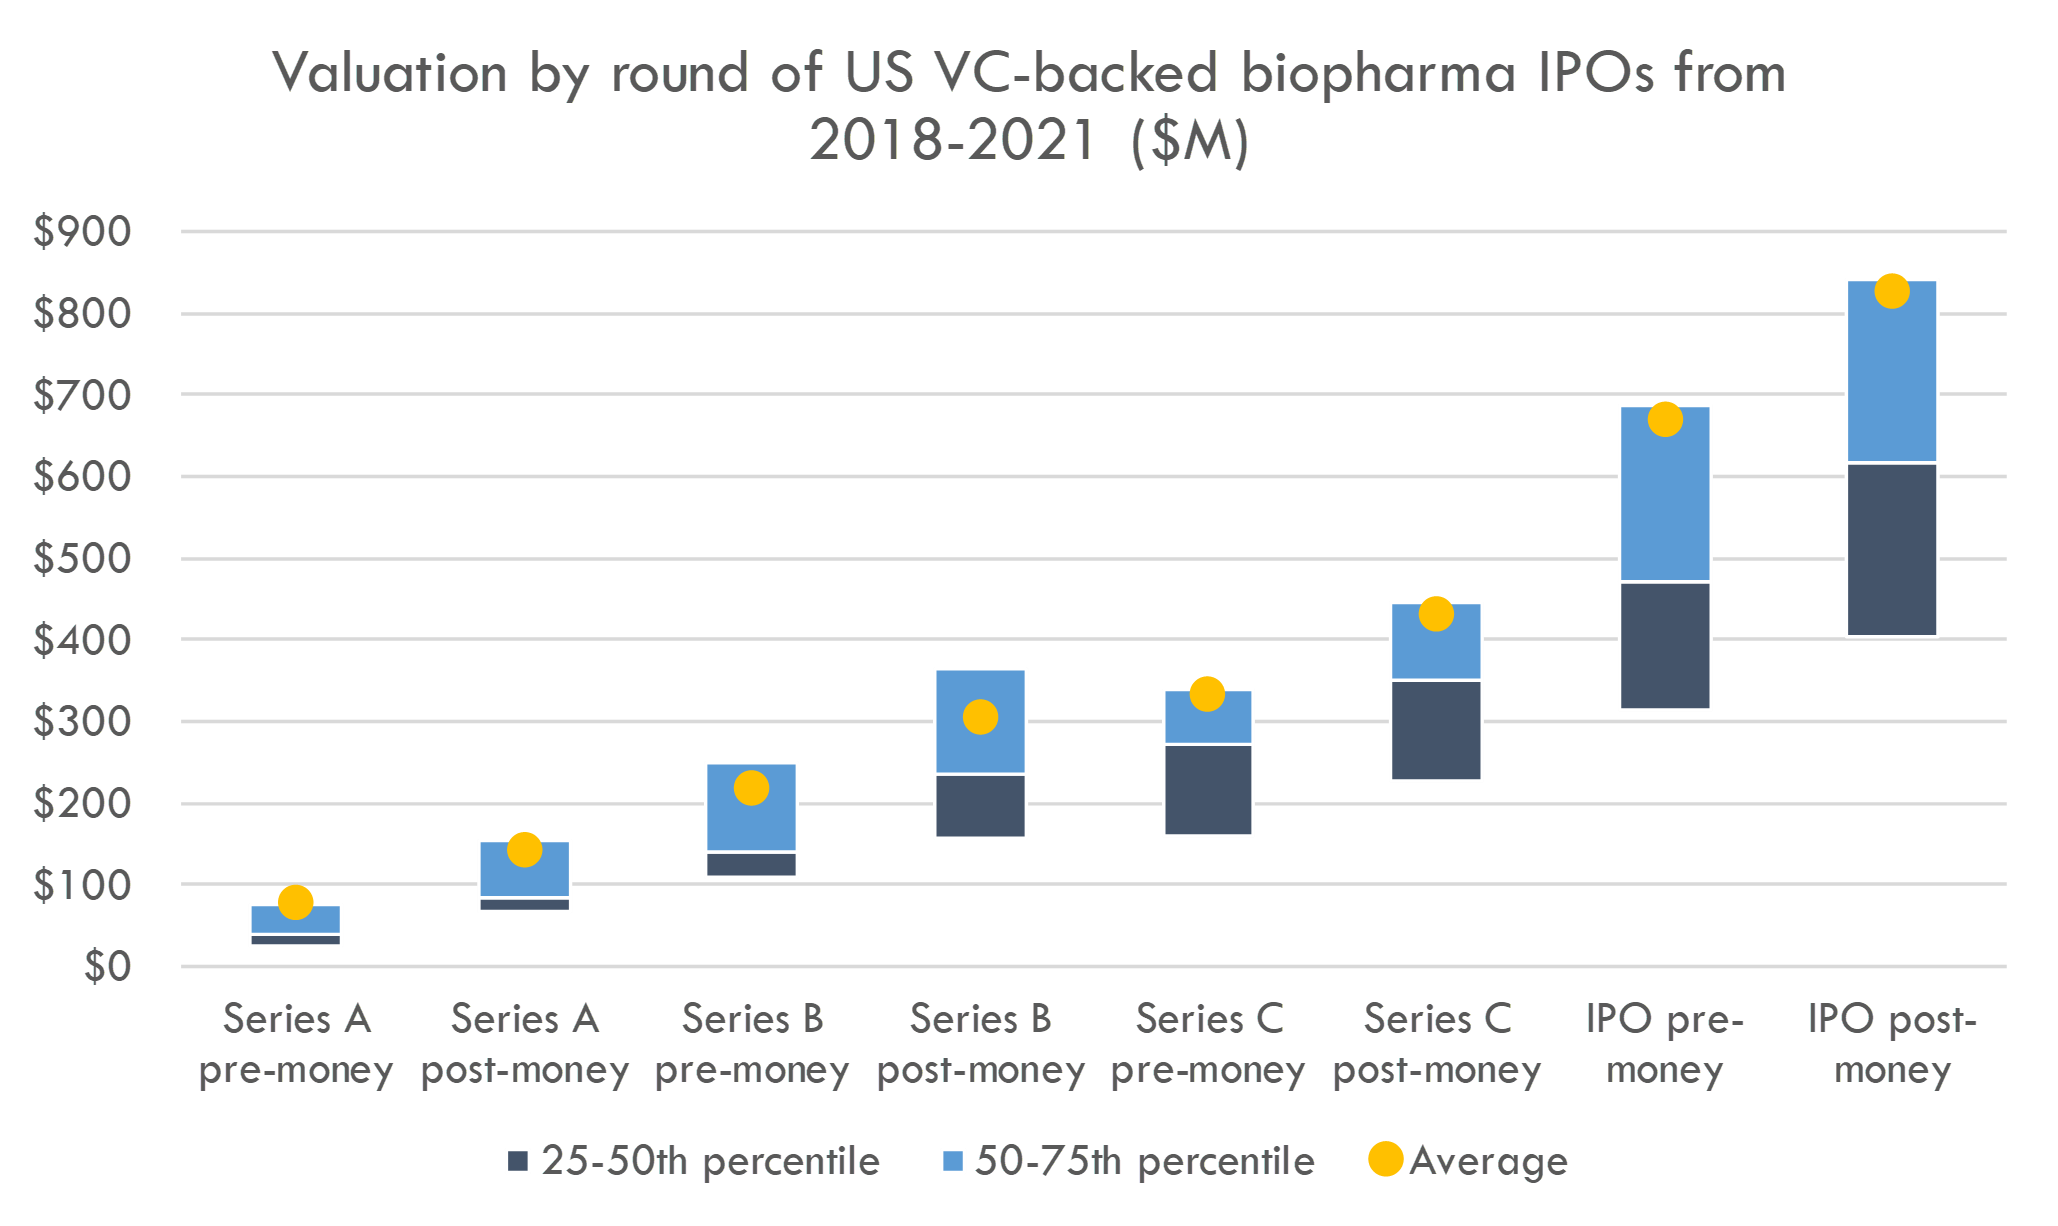
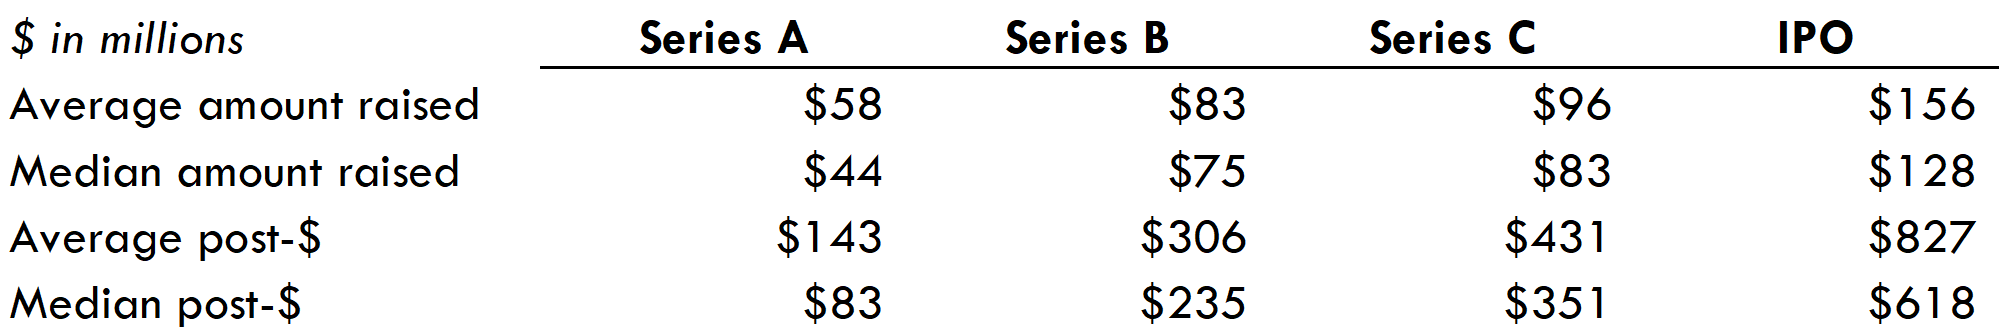
- Biotech venture funds have benefited from a very active IPO market. Biopharma startups are going public 2-2.5 years from Series A (compared to 3+ years from Series A to IPO in 2018), and less than one year from Series B. The average fully diluted valuation at IPO of companies that went public from 2018-2021 was $827M (median $618M).
- The IPO boom accelerated during COVID, but has recently lost steam. While it is unclear what will happen to the IPO market in 2022, the Fed's planned unwinding of COVID stimulus will remove a major tailwind that has supported the market.
- Because venture returns over the last few years have been driven primarily by IPOs (as opposed to M&A), a sustained downturn in the IPO market will have a significant impact on private funding. Investors still have plenty of capital, but may reserve more capital to support their portfolio companies rather than funding new startups.
- Returns of biotech venture funds have been higher than software venture funds on an IRR basis, but not a cash-on-cash basis. If companies take longer to IPO, biotech venture IRRs will likely take a hit.
To stay updated on biopharma venture funding, IPO and venture-backed M&A activity, check out our biopharma startup dashboard.
Valuation of venture rounds
Below are the pre- and post-money valuations of Series A, B and C investments, as well as IPO valuations, of venture-backed biopharma companies that went public from 2018-2021.
Defensible clinical trial cost estimates
Get transparent cost estimates for any trial in minutes. Input an NCT ID or upload a protocol, then see a full cost analysis report.
Overall, we looked at 213 total companies (only including VC-backed companies that did IPOs of over $50M on NASDAQ or NYSE from 2018-2021).
Most companies that IPO do so after Series B. This provides both Series A and B investors with nice step-ups (see more on step-ups in this post). Companies that IPO after Series C do not have a higher IPO valuation than those that IPO earlier, so if companies require additional private funding to IPO, that will hurt venture returns.
If the IPO market does experience a sustained period of lower volume, how will venture investors respond? It is too early to tell, but we can speculate.
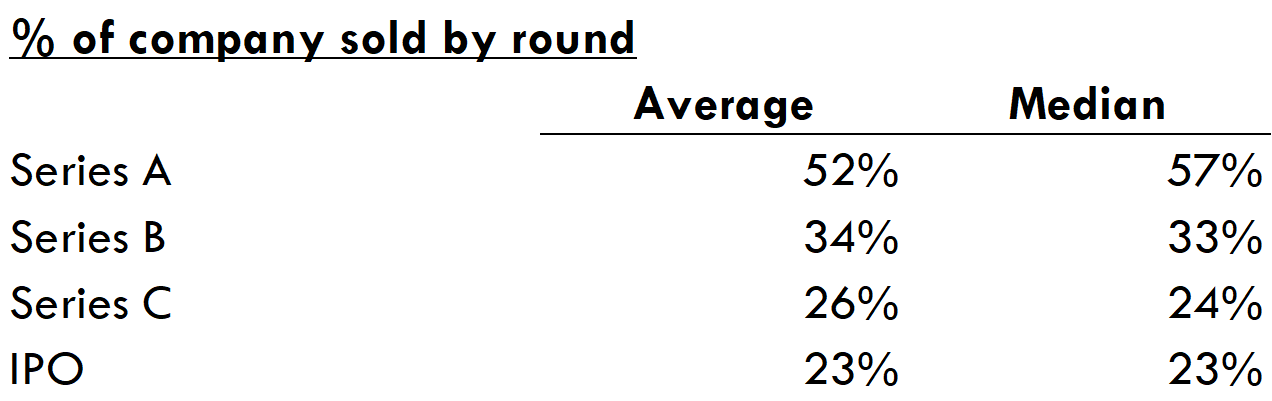
One way for investors to counteract this downward pressure on returns is to decrease the valuations at which they invest. There are two main ways to do this: 1) reduce the equity that management gets or 2) reduce the amount that they invest into the company. In some parts of the seed and Series A market, founders retain a large chunk of equity, but in general VCs control almost 60% of the company after Series A, which doesn't leave a lot of room to decrease the equity of management and employees.
The average / median Series A round bought 52% / 57% of the company. The typical B round bought ~1/3 of the company, and C rounds generally bought 25% of the company.
Venture investors can also decrease company valuations by decreasing the amount they invest in a round. However, these funds are sitting on massive piles of cash to invest, and round sizes have been getting bigger and bigger to accommodate this. This provides some upward pressure on valuations.
In a world where VCs need to invest large amounts of cash, but the IPO and crossover market faces continued pressure, one scenario for private markets is that VCs set aside more capital to fund their best companies. These companies used to raised a Series B from crossover investors and then go public, but that is not as easy in the current market. Crossover investors have been hit hard by biotech's poor recent stock performance, and Series A investors may set aside more funds to support companies that would have previously raised from crossover investors.
Investors may also look to fund companies that are more attractive to M&A buyers as opposed to IPO investors. It isn't clear what types of companies big pharma will buy (although there is plenty of speculation on the topic), but we can examine the attributes of companies that have attracted IPO investors.
Characteristics of IPO'd companies
We looked at the major development programs of companies that went public from 2018-2021 and classified each program by therapeutic modality 1:
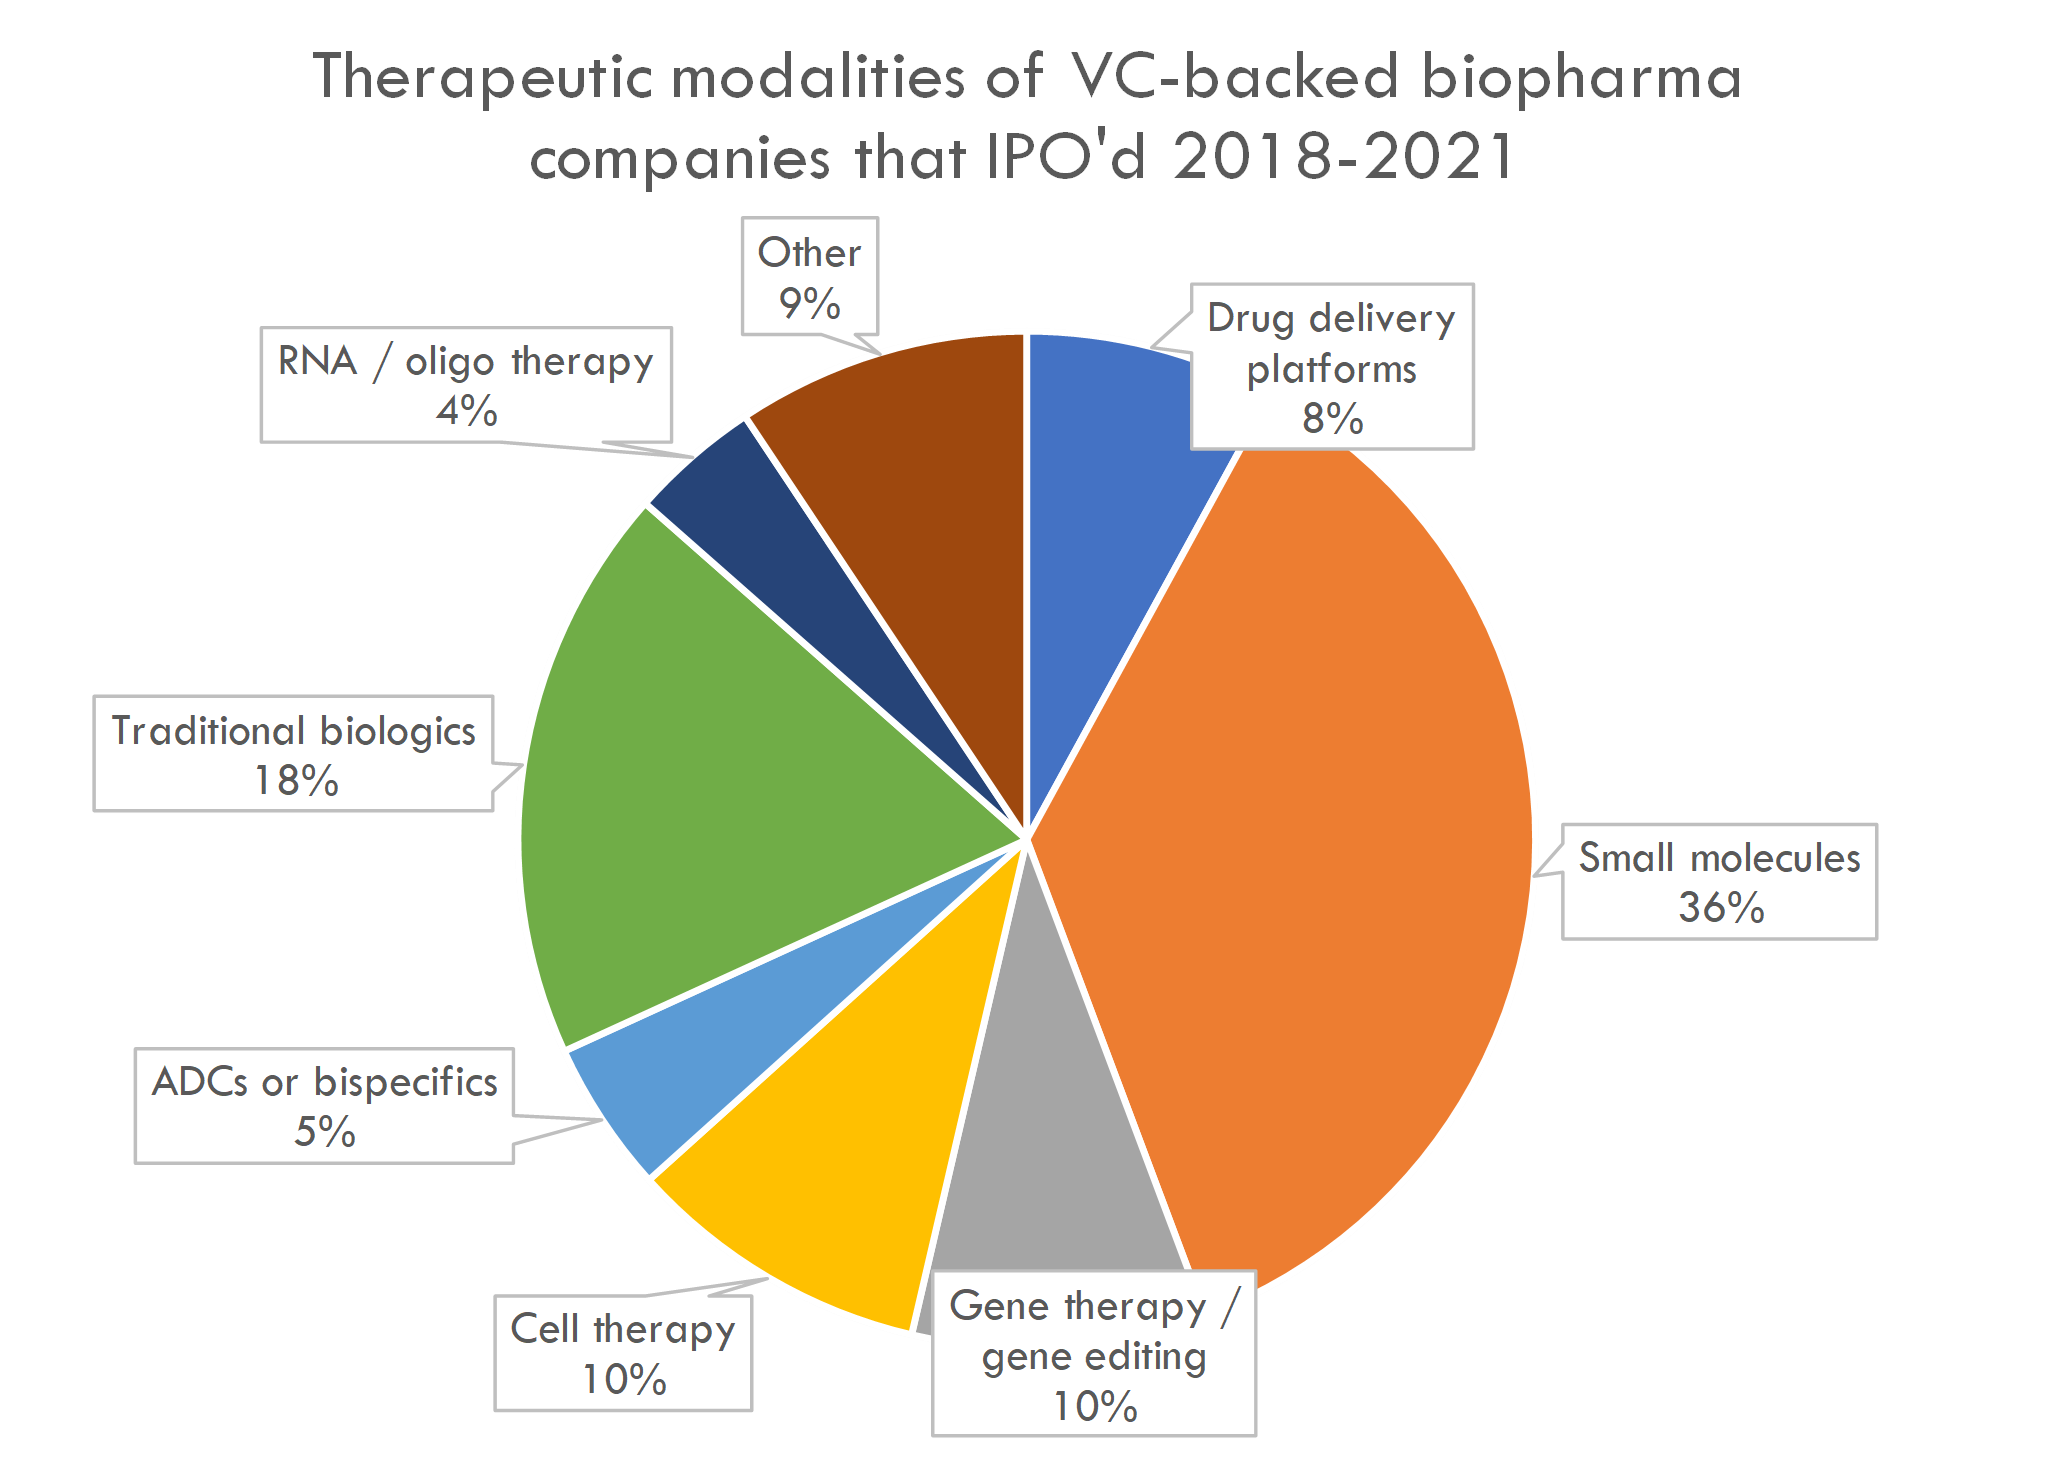
20% of programs were gene or cell therapy programs, 5% were antibody-drug conjugates or bispecific antibodies, and 4% were RNA or other oligonucleotide therapy programs.
Small molecules represent 36% of development programs of newly public companies. According to HBM's 2019 New Drug Approval report, over the last ~10 years, ~75% of new FDA-approved drugs have been small molecules. As one might expect, startup IPOs are "enriched" for novel modalities compared to historical drug development programs.
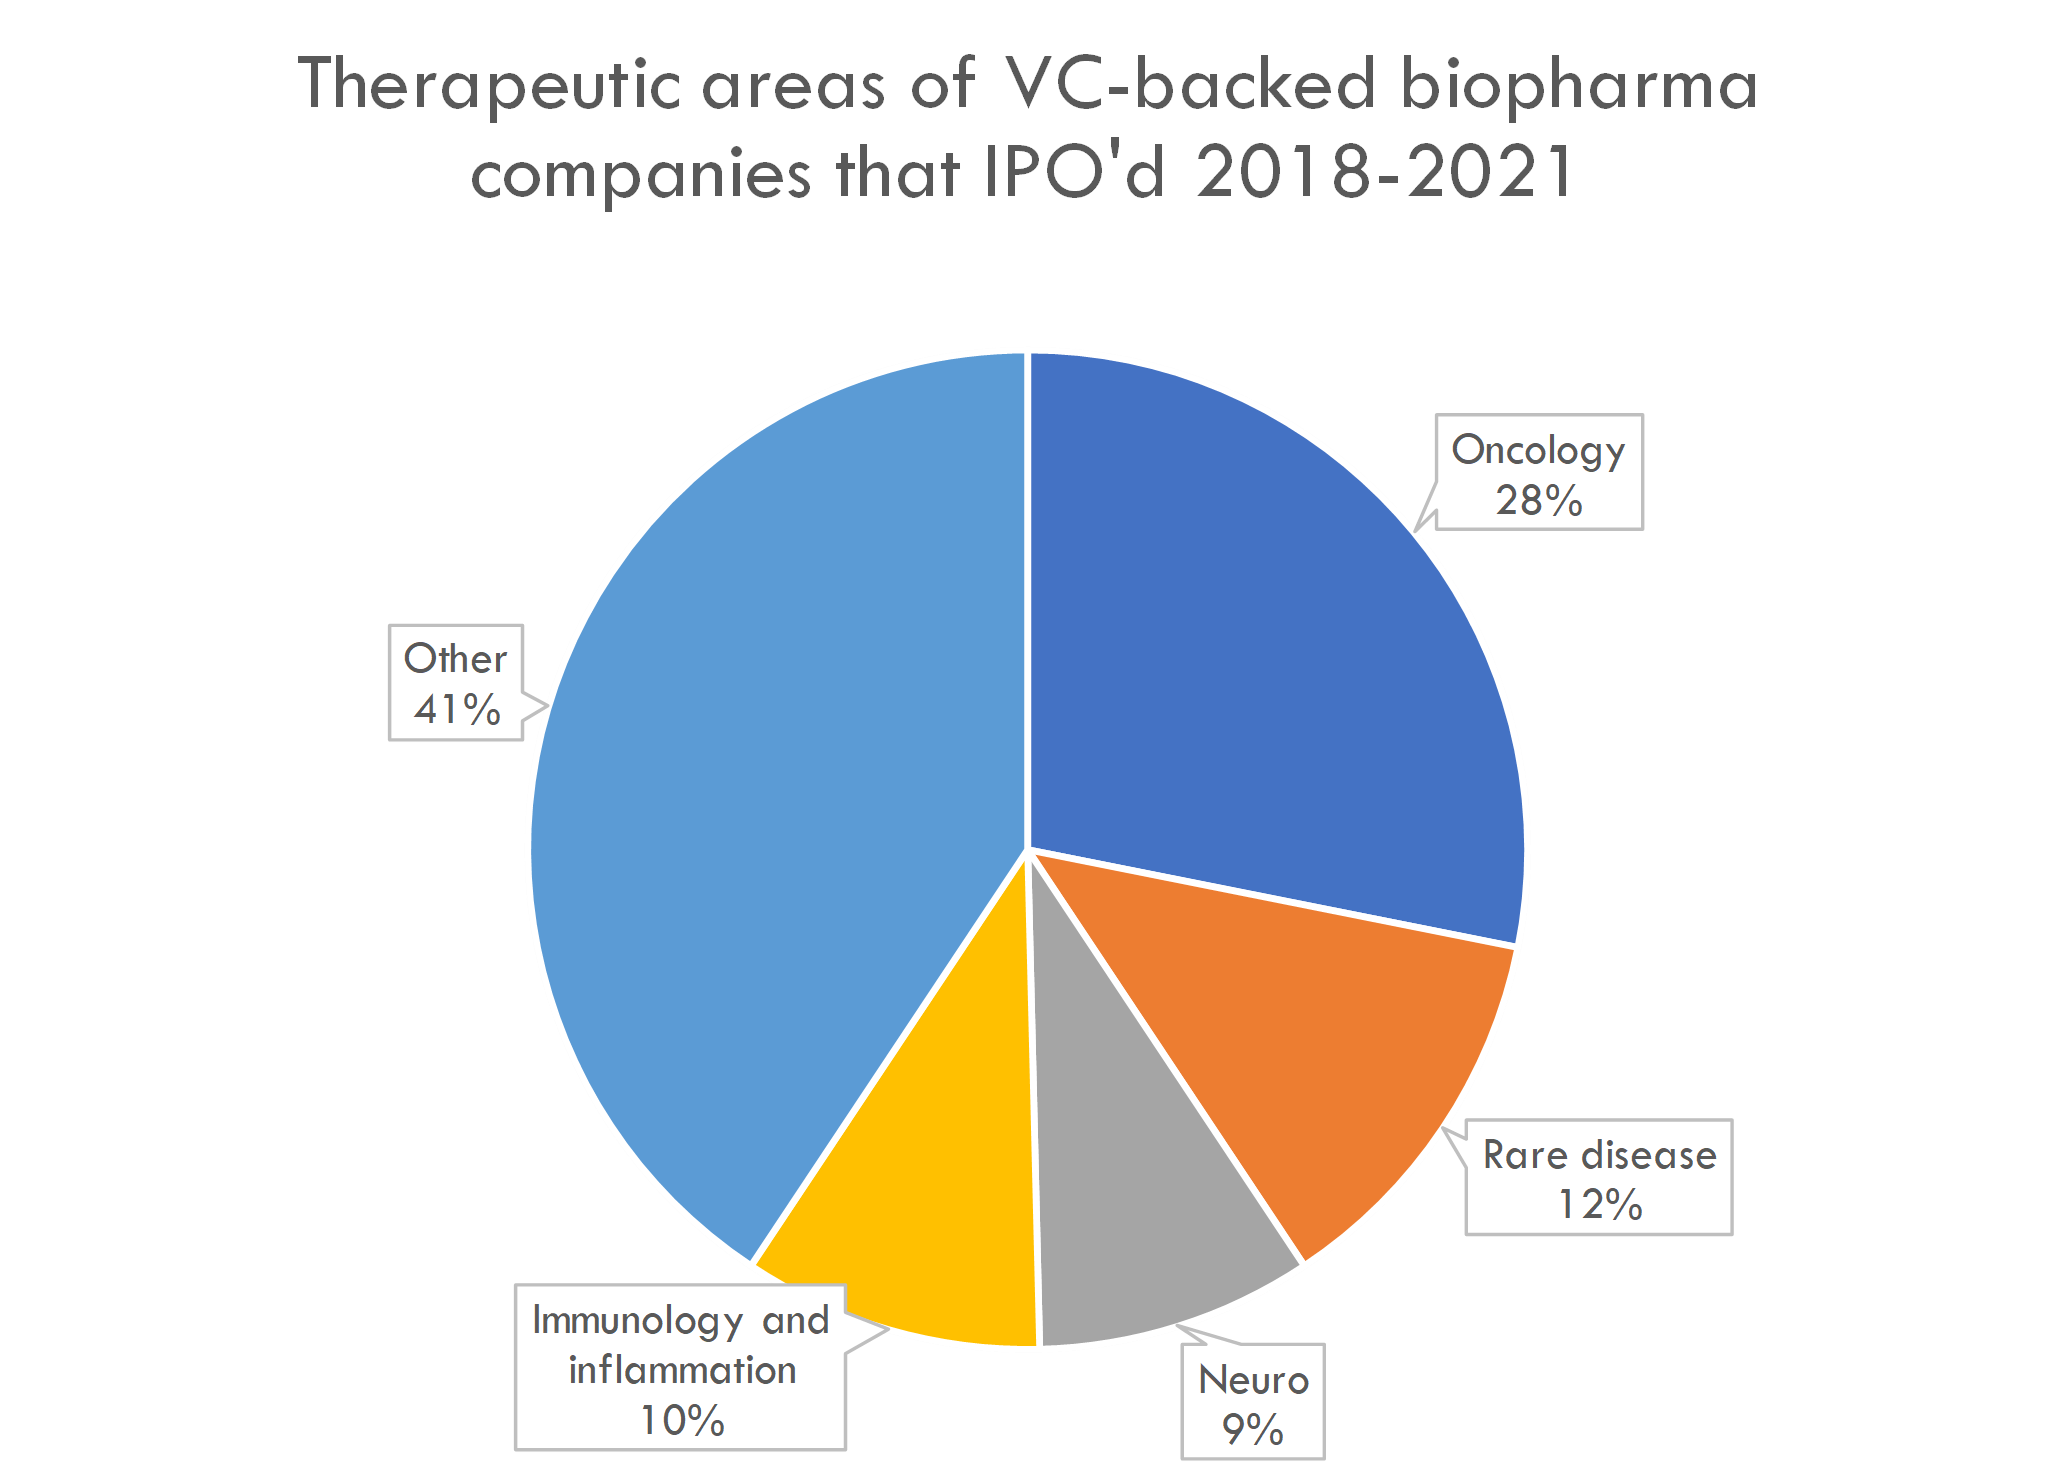
The therapeutic areas and development stage of newly public companies is not surprising: most companies that IPO are in Phase 1 or 2, and many are working on cancer and rare disease:
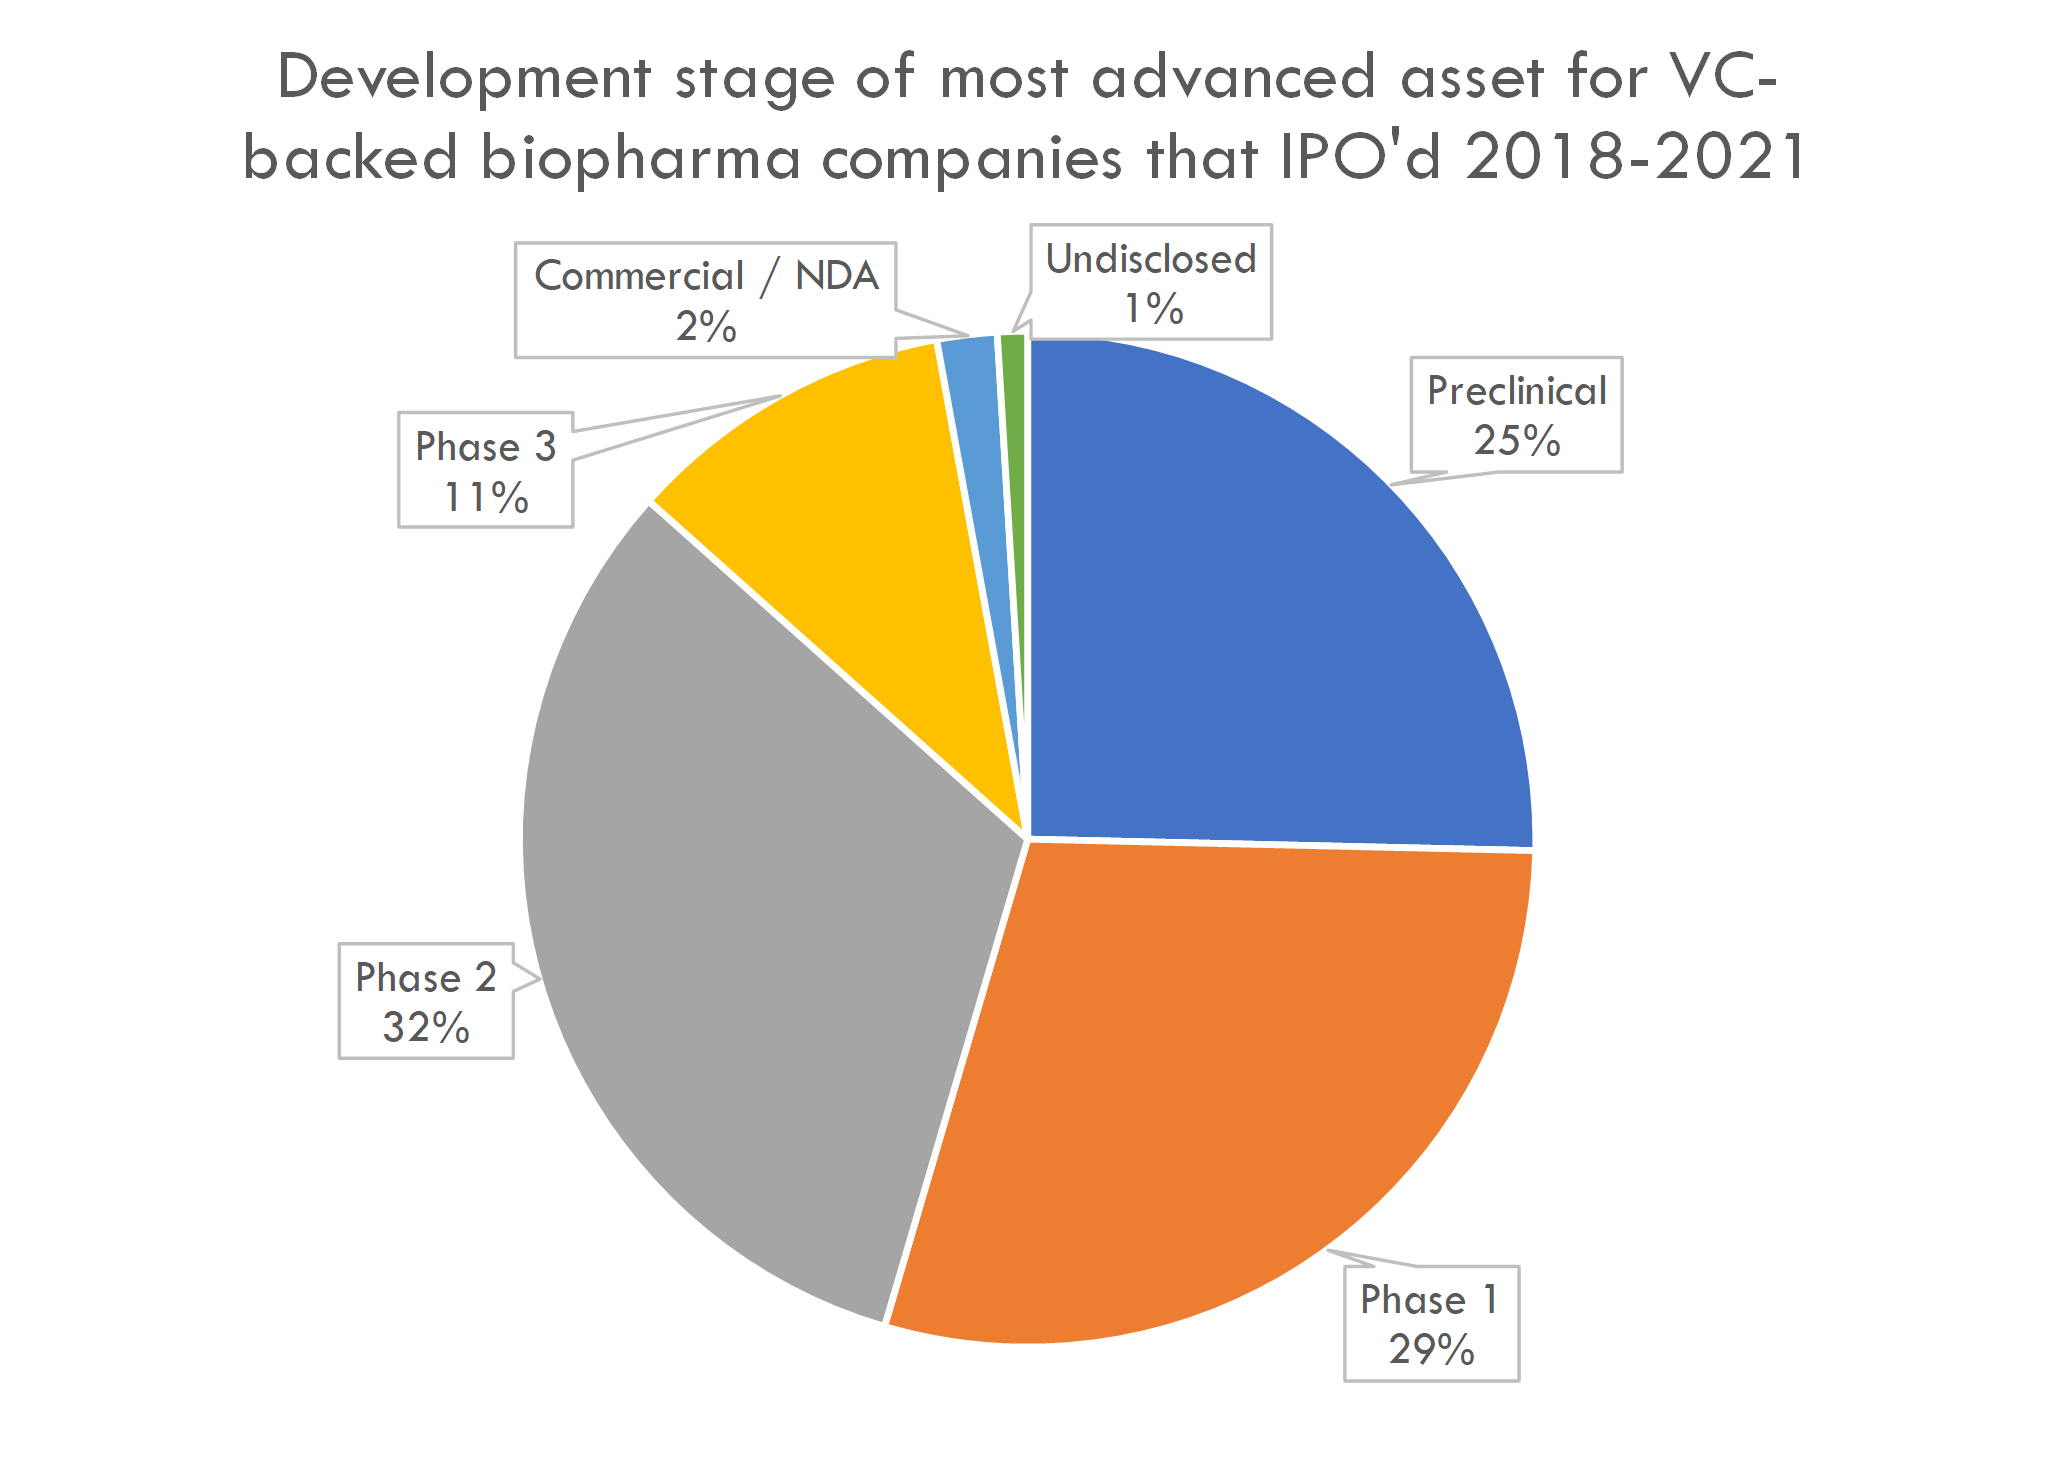
The number of preclinical IPOs is high by historical standards: in 2018, 16% of startup IPOs were preclinical companies, with an even lower percentage prior to that. This is likely a function of fundamental as well as market factors, including the Fed's aggressive COVID stimulus, Moderna and BioNTech's successful mRNA-based COVID vaccines driving investor interest in next-gen platforms, and a market perception that the risk of drug development is decreasing.
Valuation by therapeutic area and modality
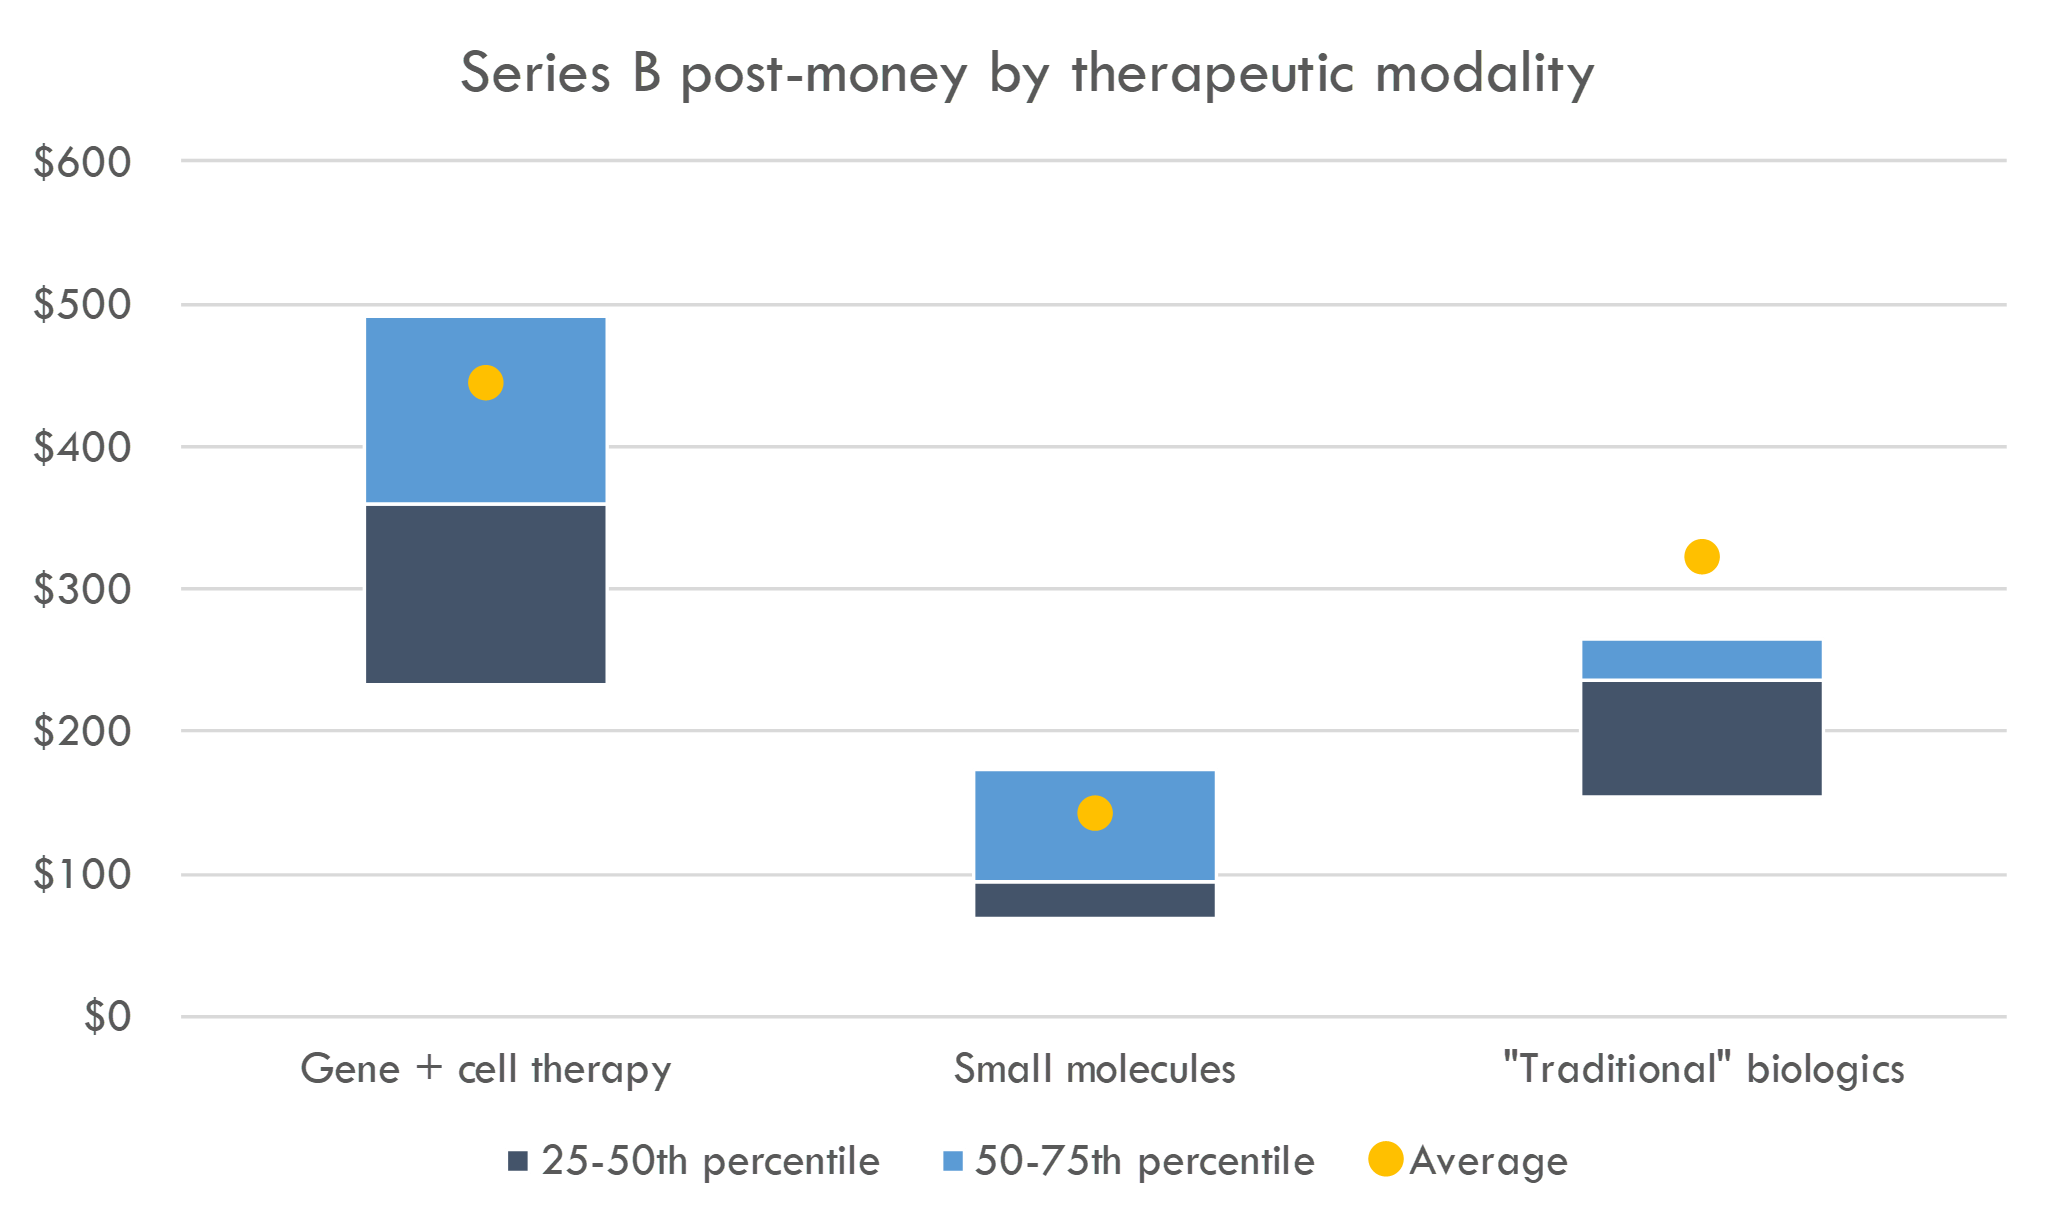
As discussed above, IPO investors are increasingly interested in gene and cell therapy companies. Do these companies garner higher valuations?
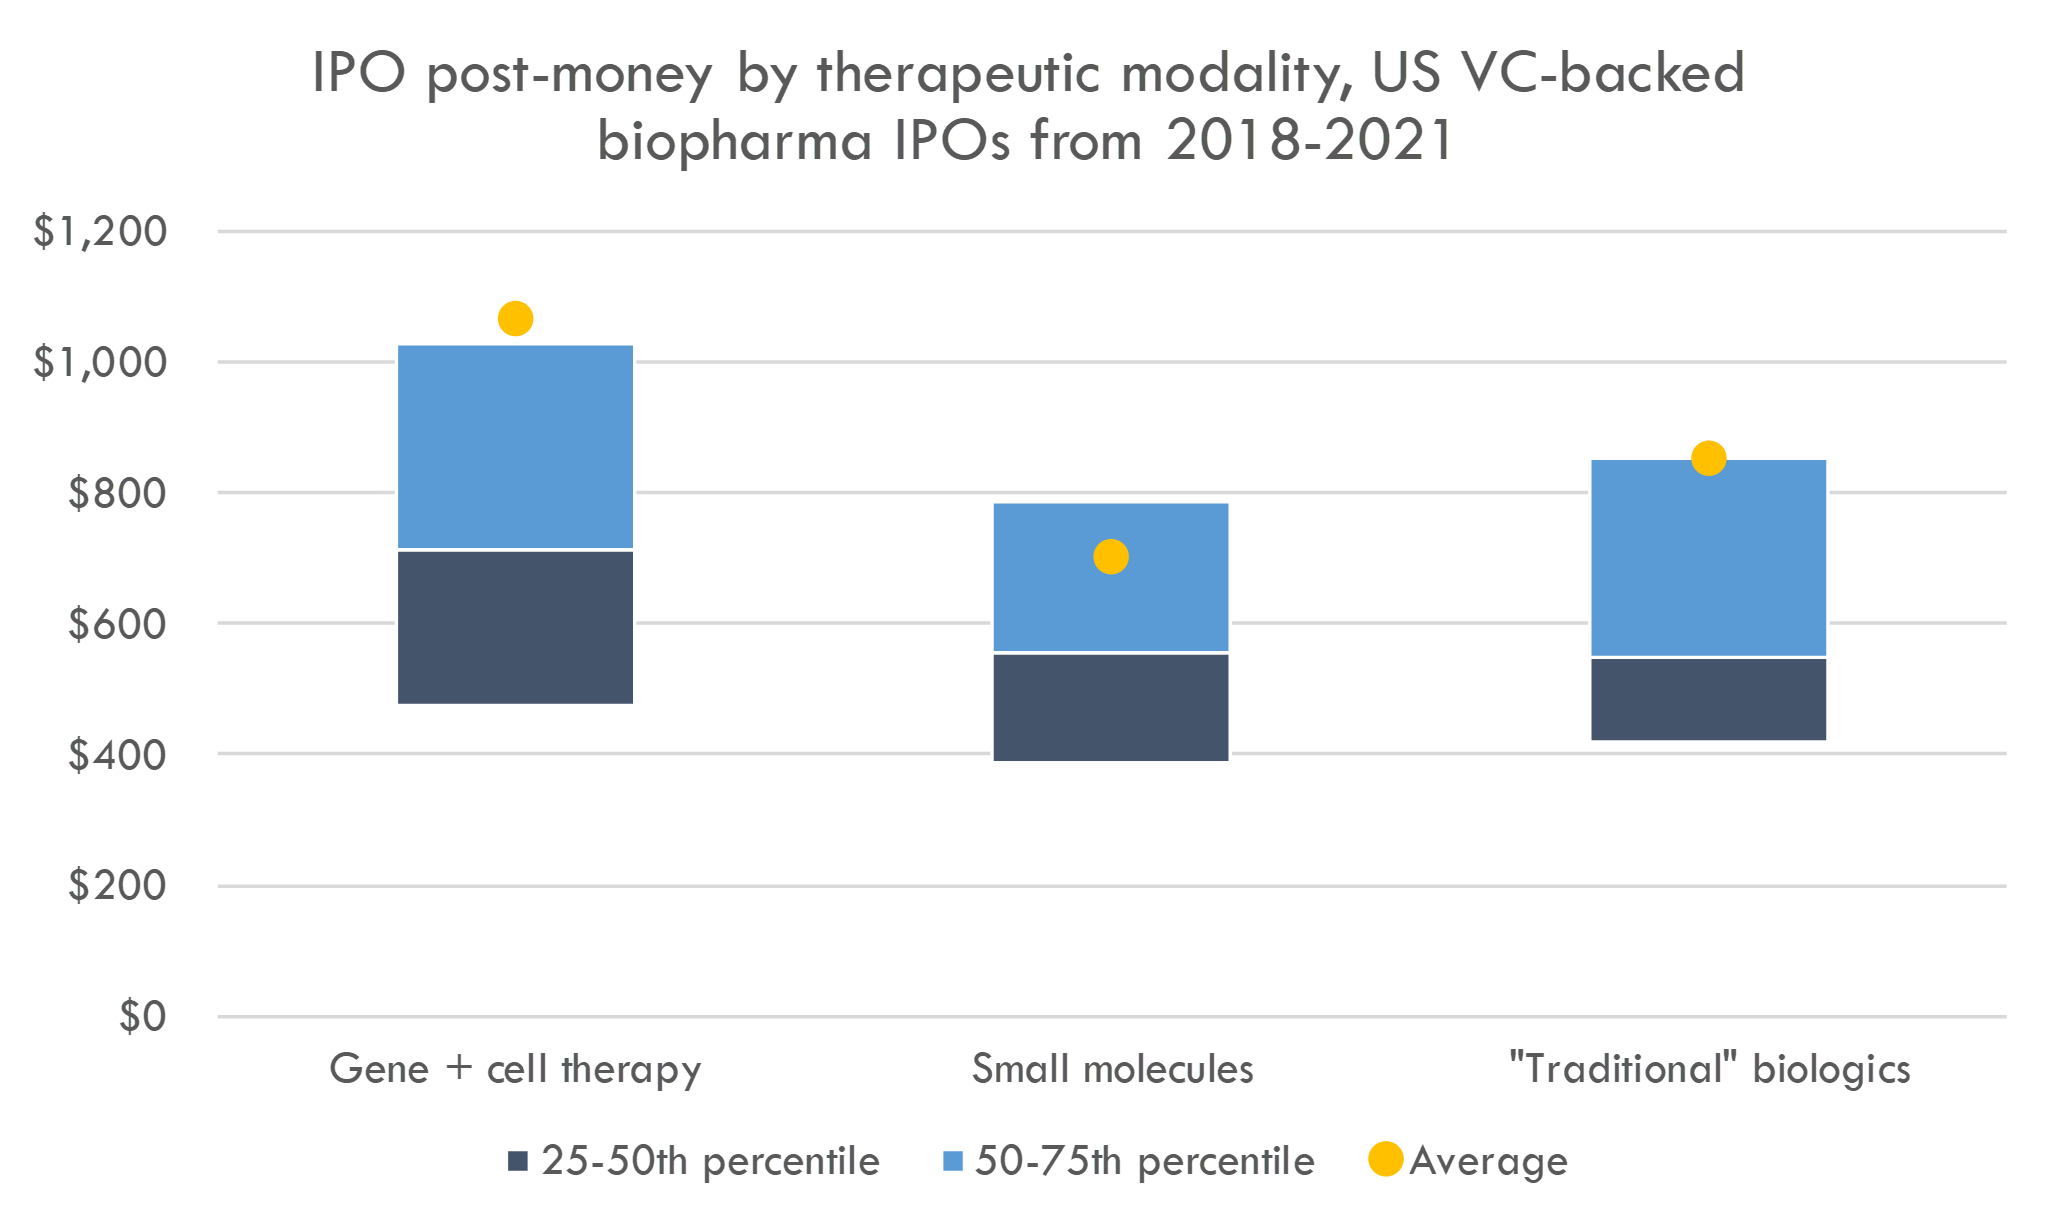
Average IPO post-money valuations for gene and cell therapy companies are $1,069M (compared to $754M in 2018-Q1 2019), while the average IPO post-money for small molecule companies is $702M (compared to $461M in 2018-Q1 2019). Median post-moneys were $714M for cell and gene therapy (vs. $508M in 2018-Q1 2019) and $548M (up from $412M in 2018-Q1 2019) for small molecules (see footnote 2 for some notes on methodology).
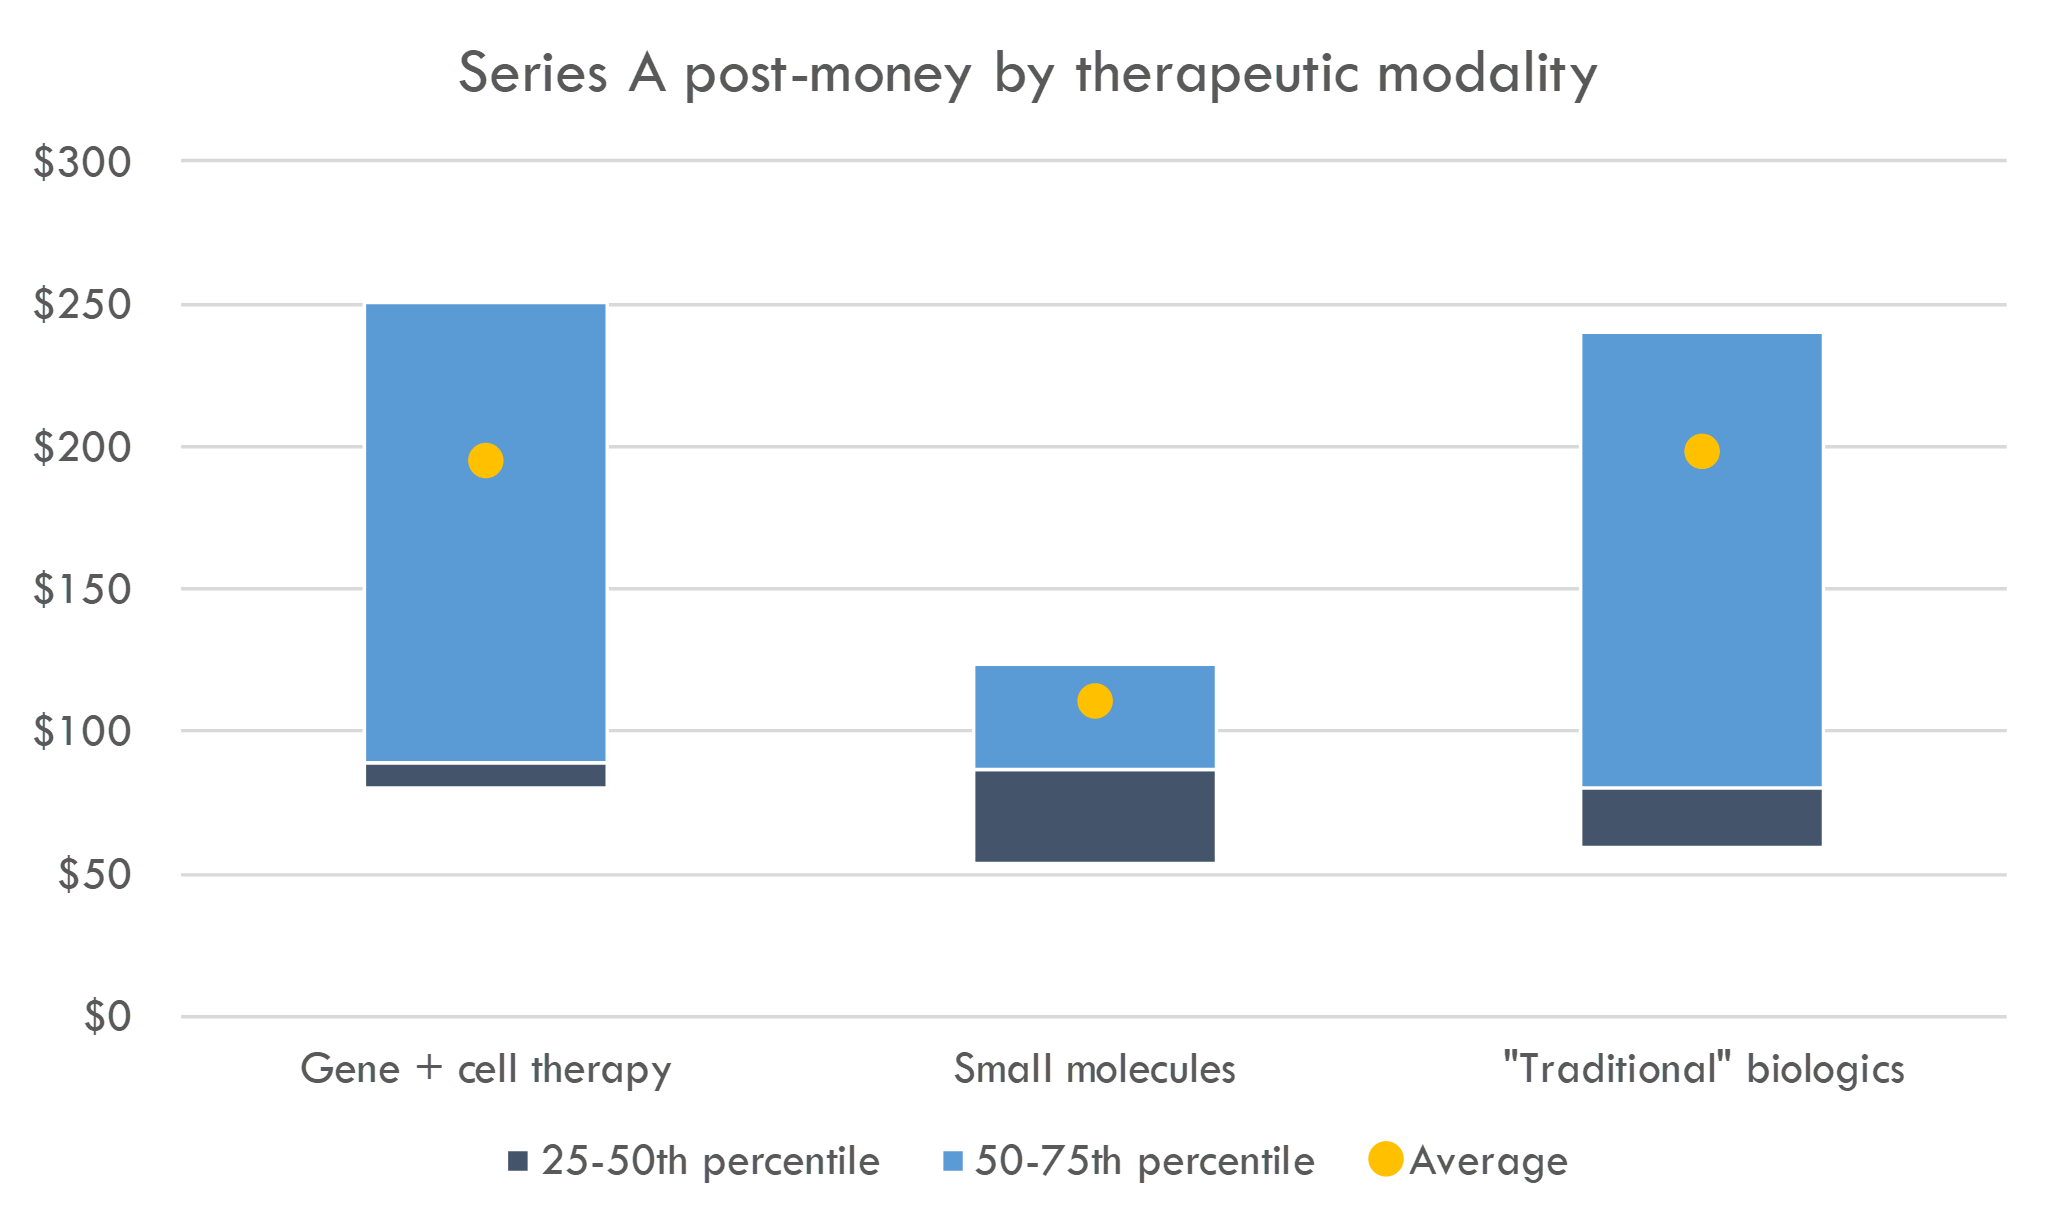
What about venture round valuations?
Defensible clinical trial cost estimates
Get transparent cost estimates for any trial in minutes. Input an NCT ID or upload a protocol, then see a full cost analysis report.
You may also like...
How to value biotech companies
Top biotech VCs in 2018 and 2019
Venture returns from biopharma IPOs, 2018-Q1 2019
List of recently funded biotech startups
Biopharma VC Basics 2: How do VCs work?
The world's most expensive drug? A case study of Zolgensma
Did you enjoy this article?
Then consider joining our mailing list. I periodically publish data-driven articles on the biotech startup and VC world.
1 Many companies have multiple programs with different therapeutic modalities.
2 A quick note on methodology: we looked at each program of the recently IPO'd companies and classified them by therapeutic modality. We then aggregated and analyzed this data. Some companies have products with multiple therapeutic modalities, so the number of programs exceeds the number of companies. However, there were no companies that had both small molecule programs and gene or cell therapy programs, so we can compare across those categories. There are companies with both between gene / cell therapy and large molecule programs, and with both small molecule and large molecule programs, so it's harder to compare these programs .